


fig5
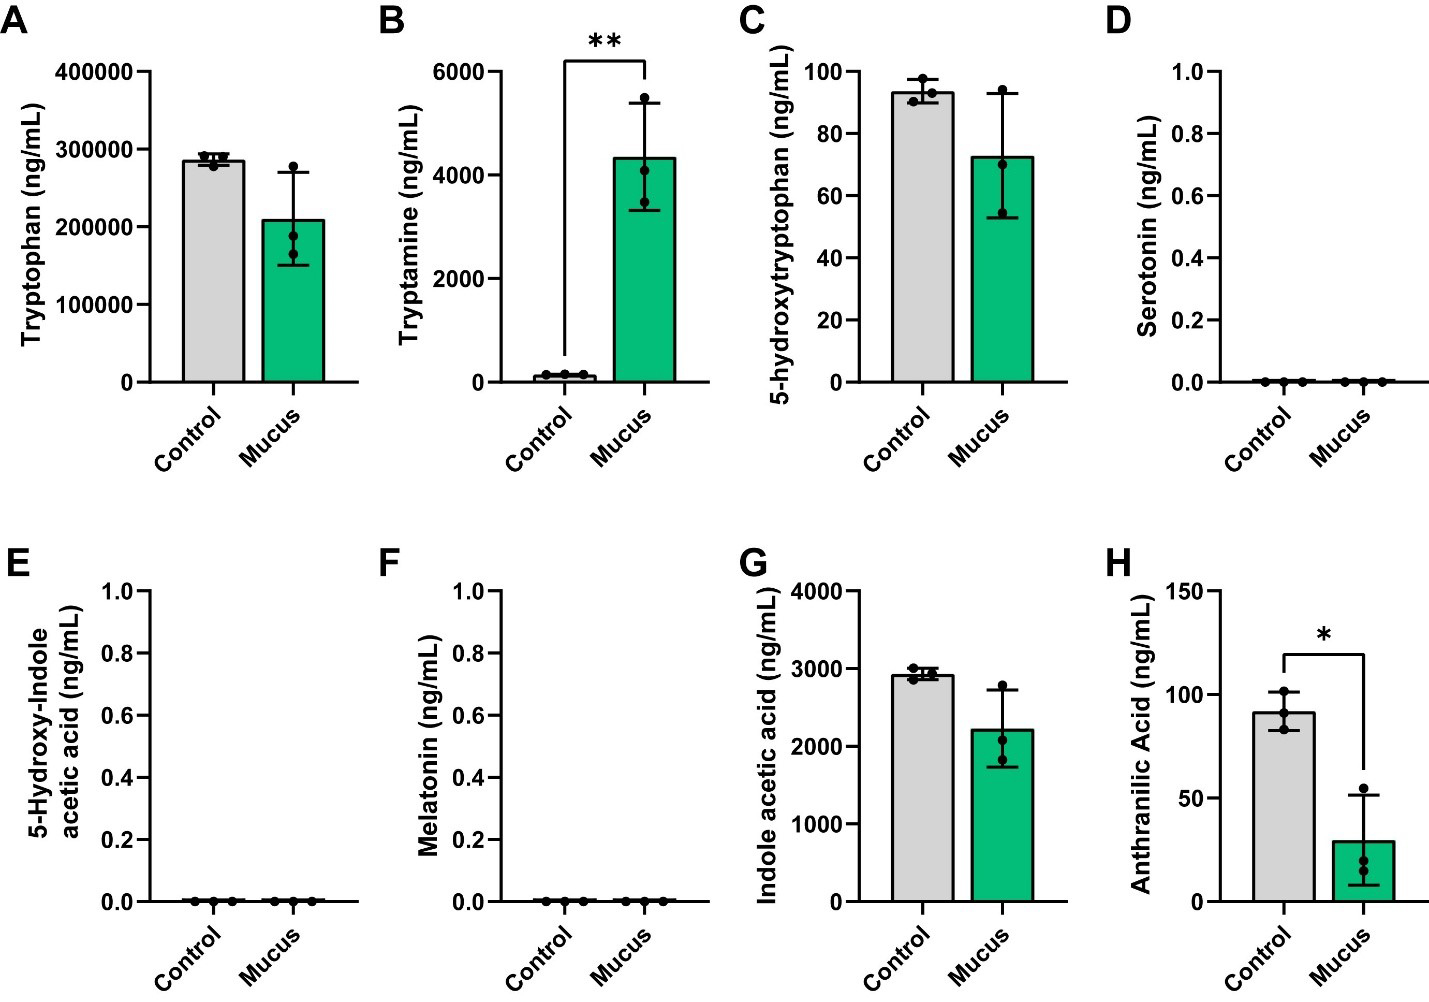
Figure 5. Individual bar graphs depicting the concentrations (ng/mL) of compounds in the tryptophan pathway in cell-free supernatant from control and MUC2-supplemented bioreactors as measured by targeted LC-MS/MS. Bar graphs represent the following compounds: (A) Tryptophan; (B) Tryptamine; (C) 5-hydroxytryptophan (5-HTP); (D) 5-hydroxytryptamine (5-HT, serotonin); (E) 5-hydroxy-indole acetic acid; (F) melatonin; (G) indole acetic acid and (H) anthranilic acid. Analyzed by Student's t-test. P < 0.05 (*), P ≤ 0.01 (**), P ≤ 0.001 (***), P ≤ 0.0001 (****). Each dot represents data from an individual bioreactor (n = 3) and each error bar represents the standard deviation. Student's T-test: P < 0.05 (*), P ≤ 0.01 (**). Graphs generated using GraphPad Prism software. MUC2: Mucin 2; LC-MS/MS: liquid chromatography-tandem mass spectrometry.


