


fig3
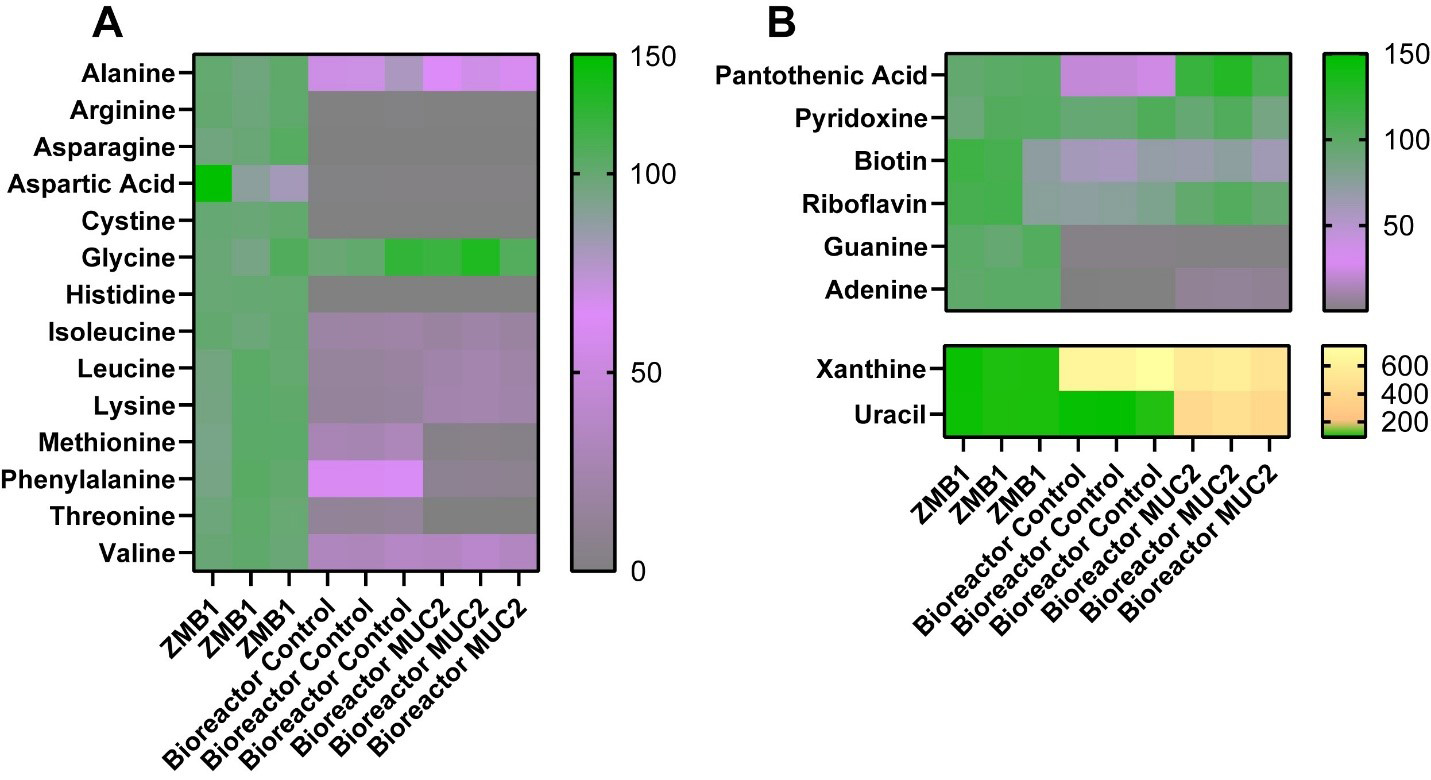
Figure 3. (A) Heat map of the percentage of amino acids in uninoculated ZMB1, control bioreactors, and MUC2-supplemented bioreactors as assessed by LC-MS/MS; (B) Heat map of the percentage of other compounds, including vitamins and nucleic acids, in uninoculated ZMB1, control bioreactors, and MUC2-supplemented bioreactors as assessed by LC-MS/MS. See Table 1 for statistical analysis. Graphs generated using GraphPad Prism software. ZMB1: MUC2: Mucin 2; LC-MS/MS: liquid chromatography-tandem mass spectrometry.


