


fig2
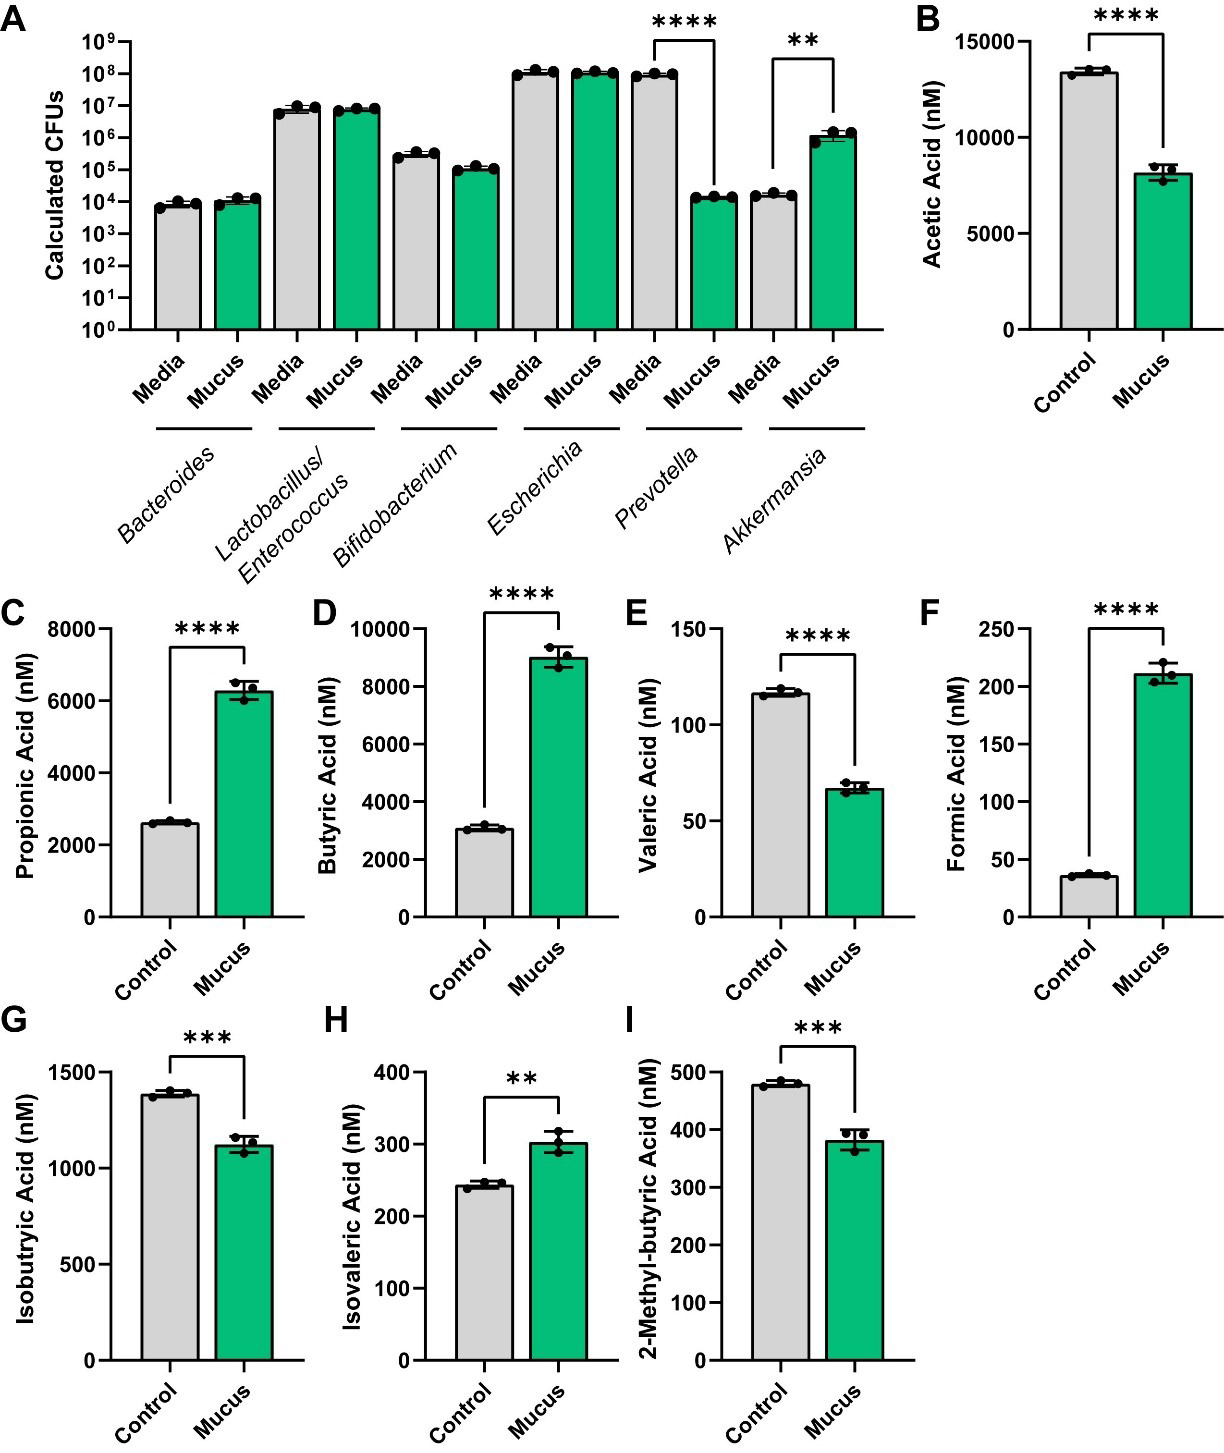
Figure 2. (A) Calculated CFUs of bacterial genera from control and MUC2-supplemented bioreactors after 72 h of growth. Analyzed by two-way ANOVA. (B-I) Individual bar graphs depicting the concentrations (nM) of short-chain fatty acids in cell-free supernatant from control and MUC2-supplemented bioreactors as measured by targeted LC-MS/MS. Bar graphs represent the following compounds: (B) acetic acid (acetate); (C) propionic acid (propionate); (D) butyric acid (butyrate); (E) valeric acid (valerate); (F) formic acid; (G) isobutyric acid (isobutyrate); (H) isovaleric acid (isovalerate); and (I) 2-methyl-butyric acid (2-methyl butyrate). Figure 2A was analyzed using two-way ANOVA, whereas Figure 2B-I was analyzed using the Student's t-test. P ≤ 0.01 (**), P ≤ 0.001 (***), P ≤ 0.0001 (****). Each dot represents data from an individual bioreactor (n = 3) and each error bar represents the standard deviation. Graphs generated using GraphPad Prism software. CFU: Colony-forming unit; MUC2: Mucin 2; ANOVA: analysis of variance; LC-MS/MS: liquid chromatography-tandem mass spectrometry.


