


fig4
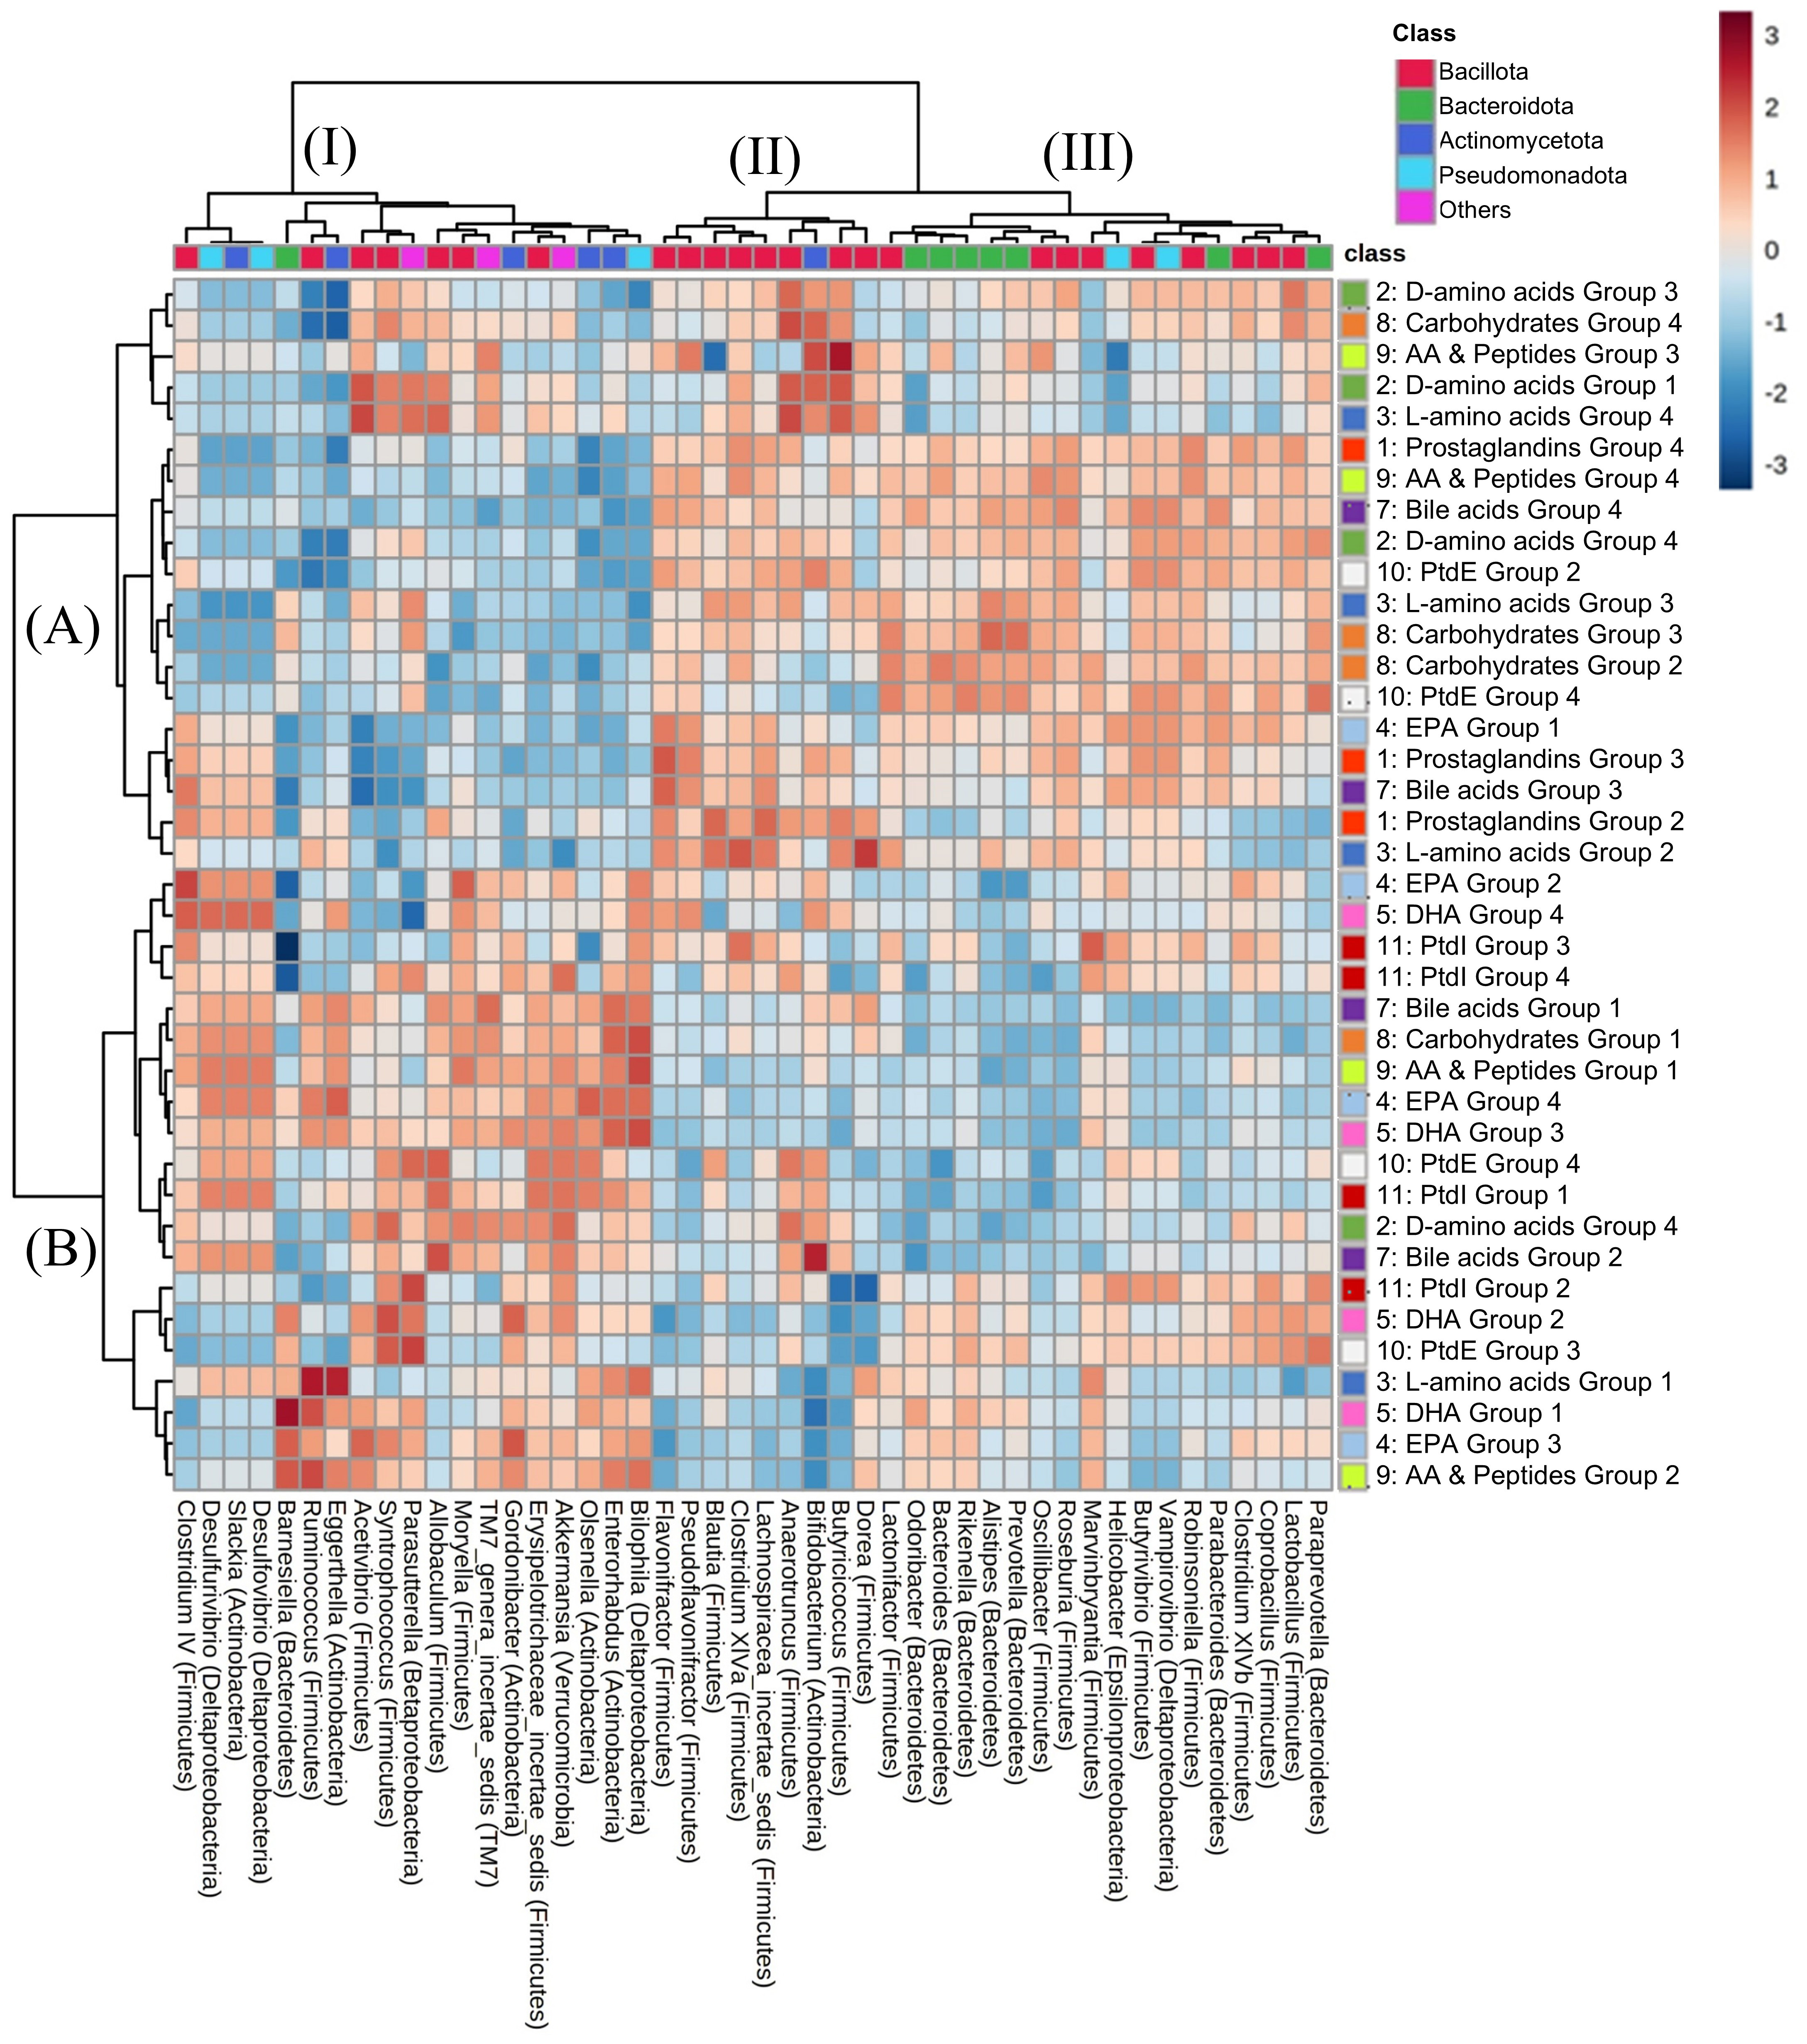
Figure 4. Correlation analysis of bacterial composition and metabolome. A heatmap representing Spearman’s rank correlation between the abundance of the metabolite group and the relative abundance of the genus based on the 16S rRNA gene sequence. Supplementary Figures 5-14 show the metabolites in groups. AA: Arachidonic acid; PtdE: phosphatidylethanolamine; EPA: eicosapentaenoic acid; DHA: docosahexaenoic acid; PtdI: phosphatidylinositol.


