


fig3
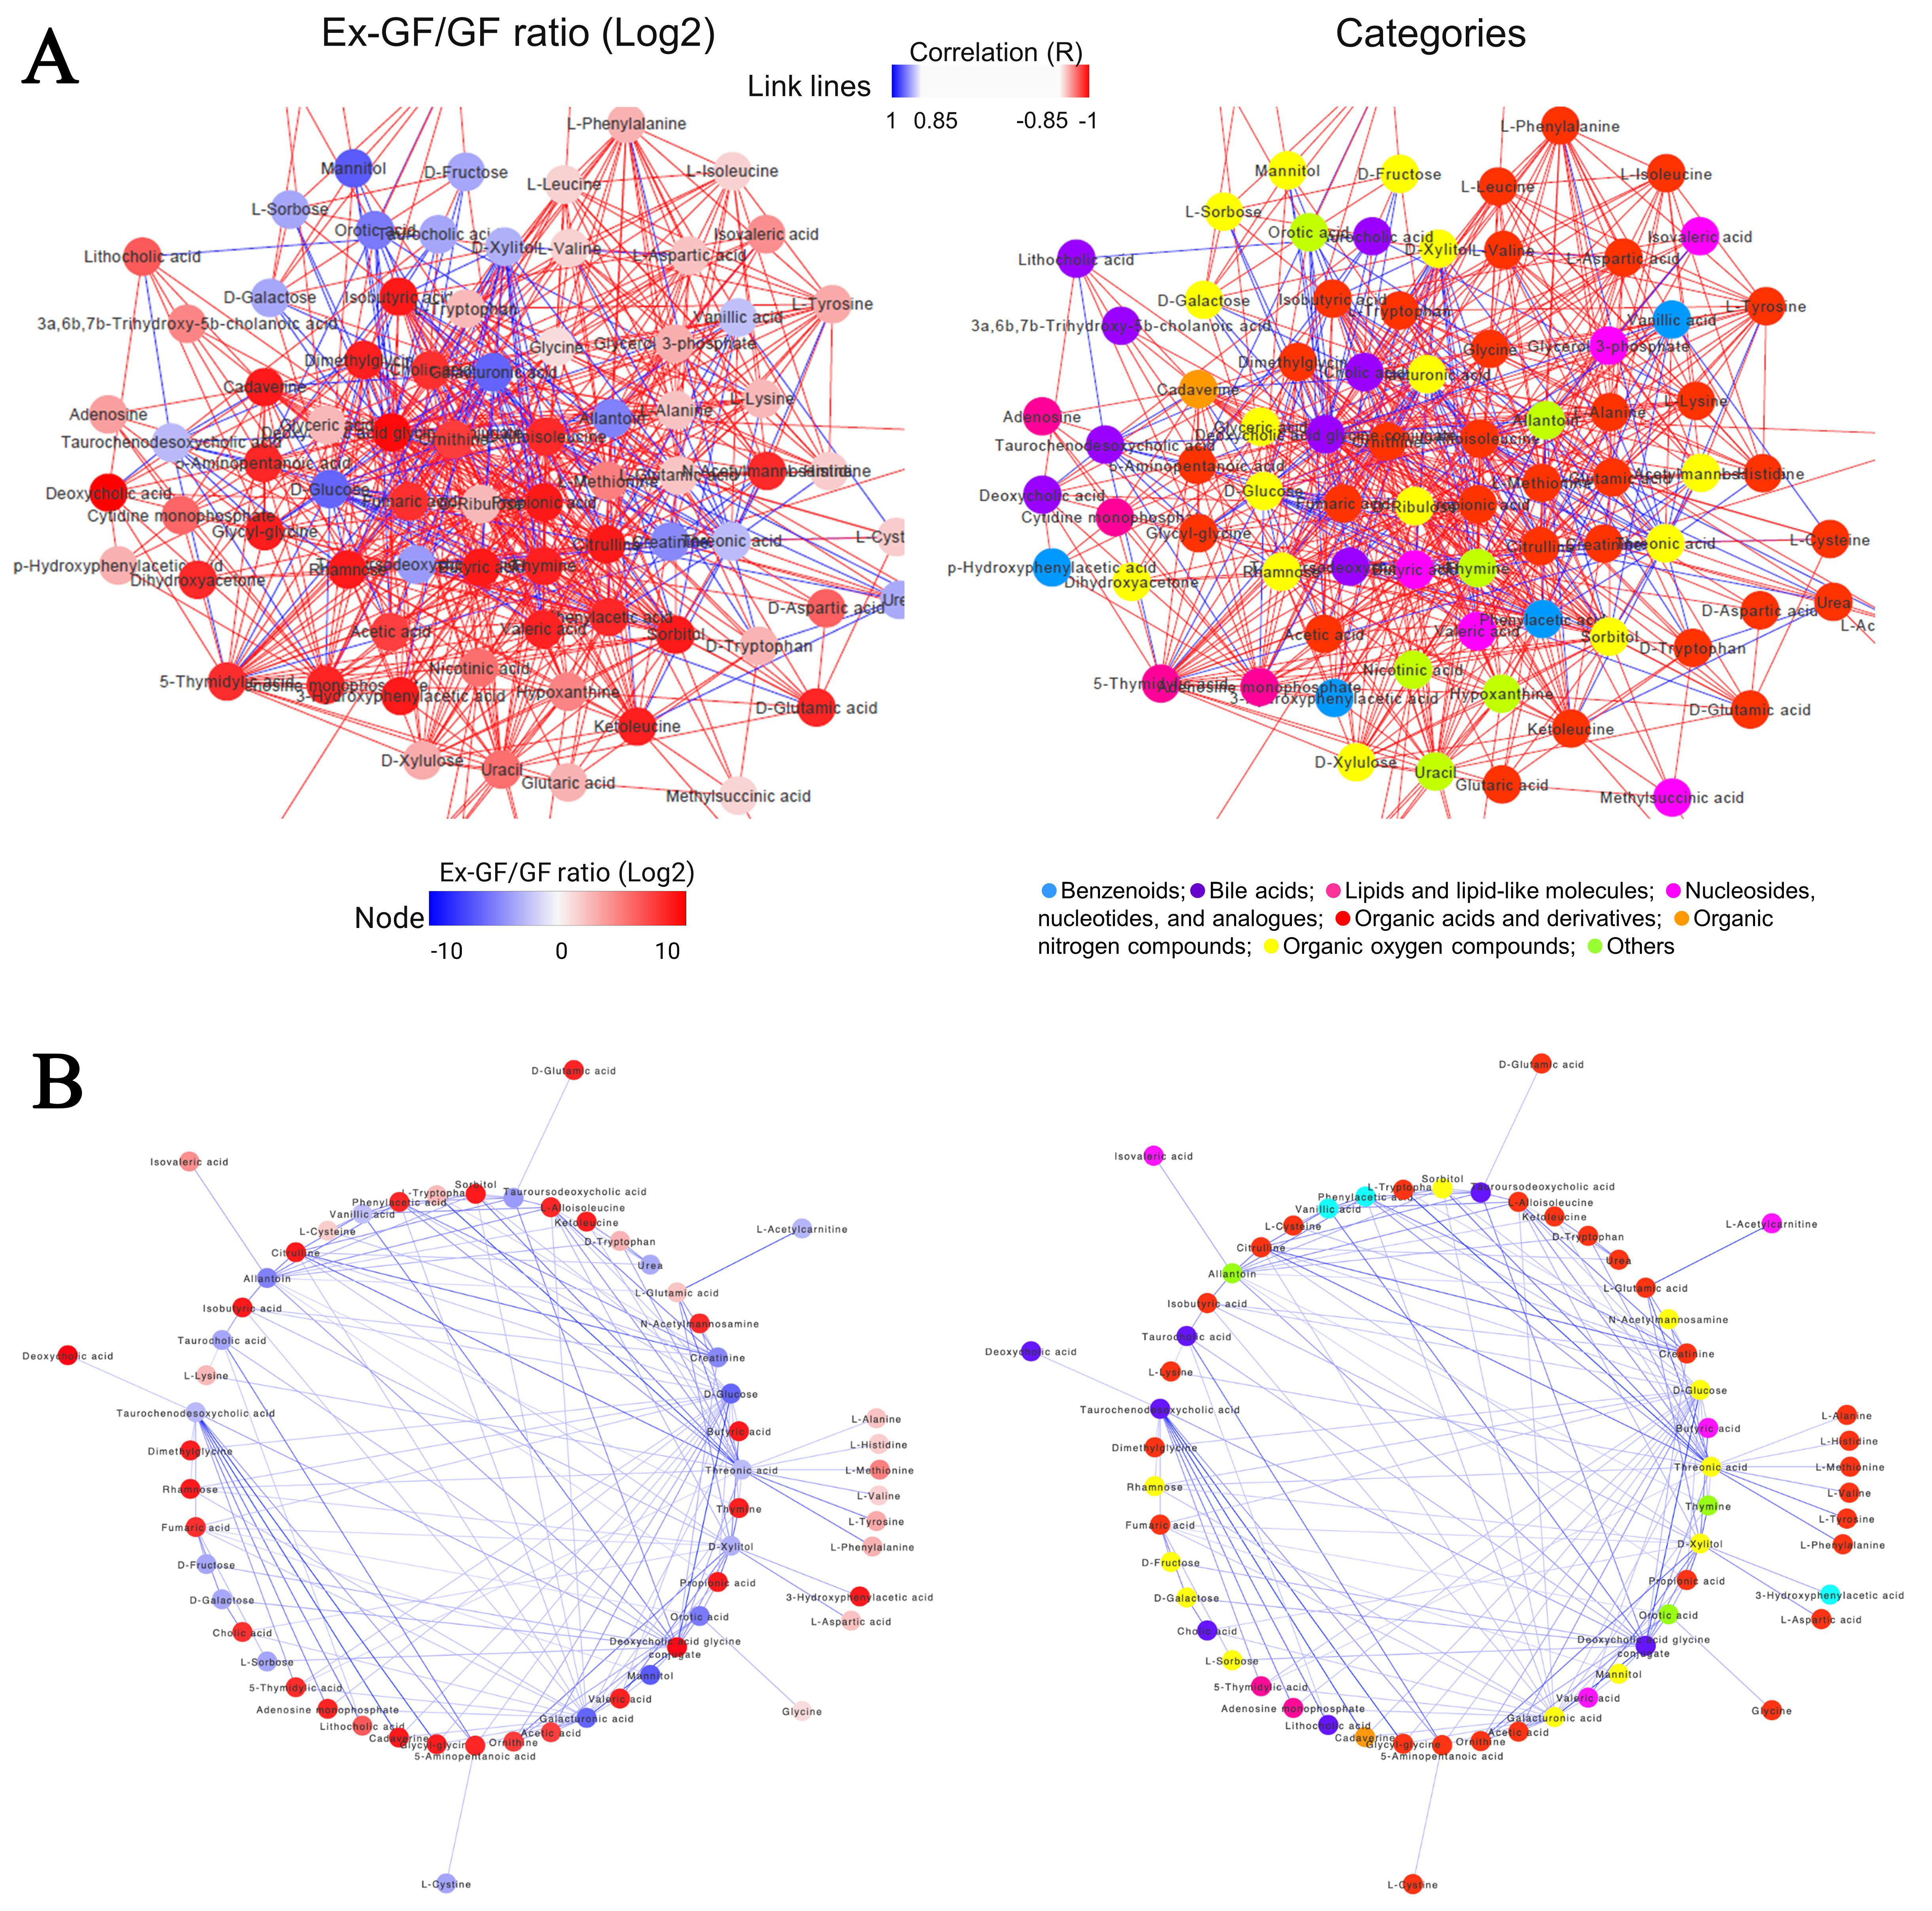
Figure 3. Correlation networks of significantly correlated faecal metabolites contained in the metabolite set library of colorectal cancer detected using MSEA (Spearman correlation: |r| > 0.85) (A) Correlation network coloured based on the ratio of Ex-GF/GF. Node colour denotes the Ex-GF/GF ratio of each metabolite (left). The correlation network is coloured based on the chemical category of metabolites (right). Node colour denotes the chemical category of each metabolite. The colour of the lines (edge) represents a positive (red) or negative (blue) correlation. The main networks were extracted from the original figures (Supplementary Figures 3 and 4 for Ex-GF/GF ratio and categories, respectively); (B) The negative correlations extracted from the upper data are based on the ratio of Ex-GF/GF (left) and the chemical category of metabolites (right). Node colours are the same as those in the upper figures. GF: Germ-free; Ex-GF: ex-germ-free; MSEA: metabolite set enrichment analysis.


