


fig2
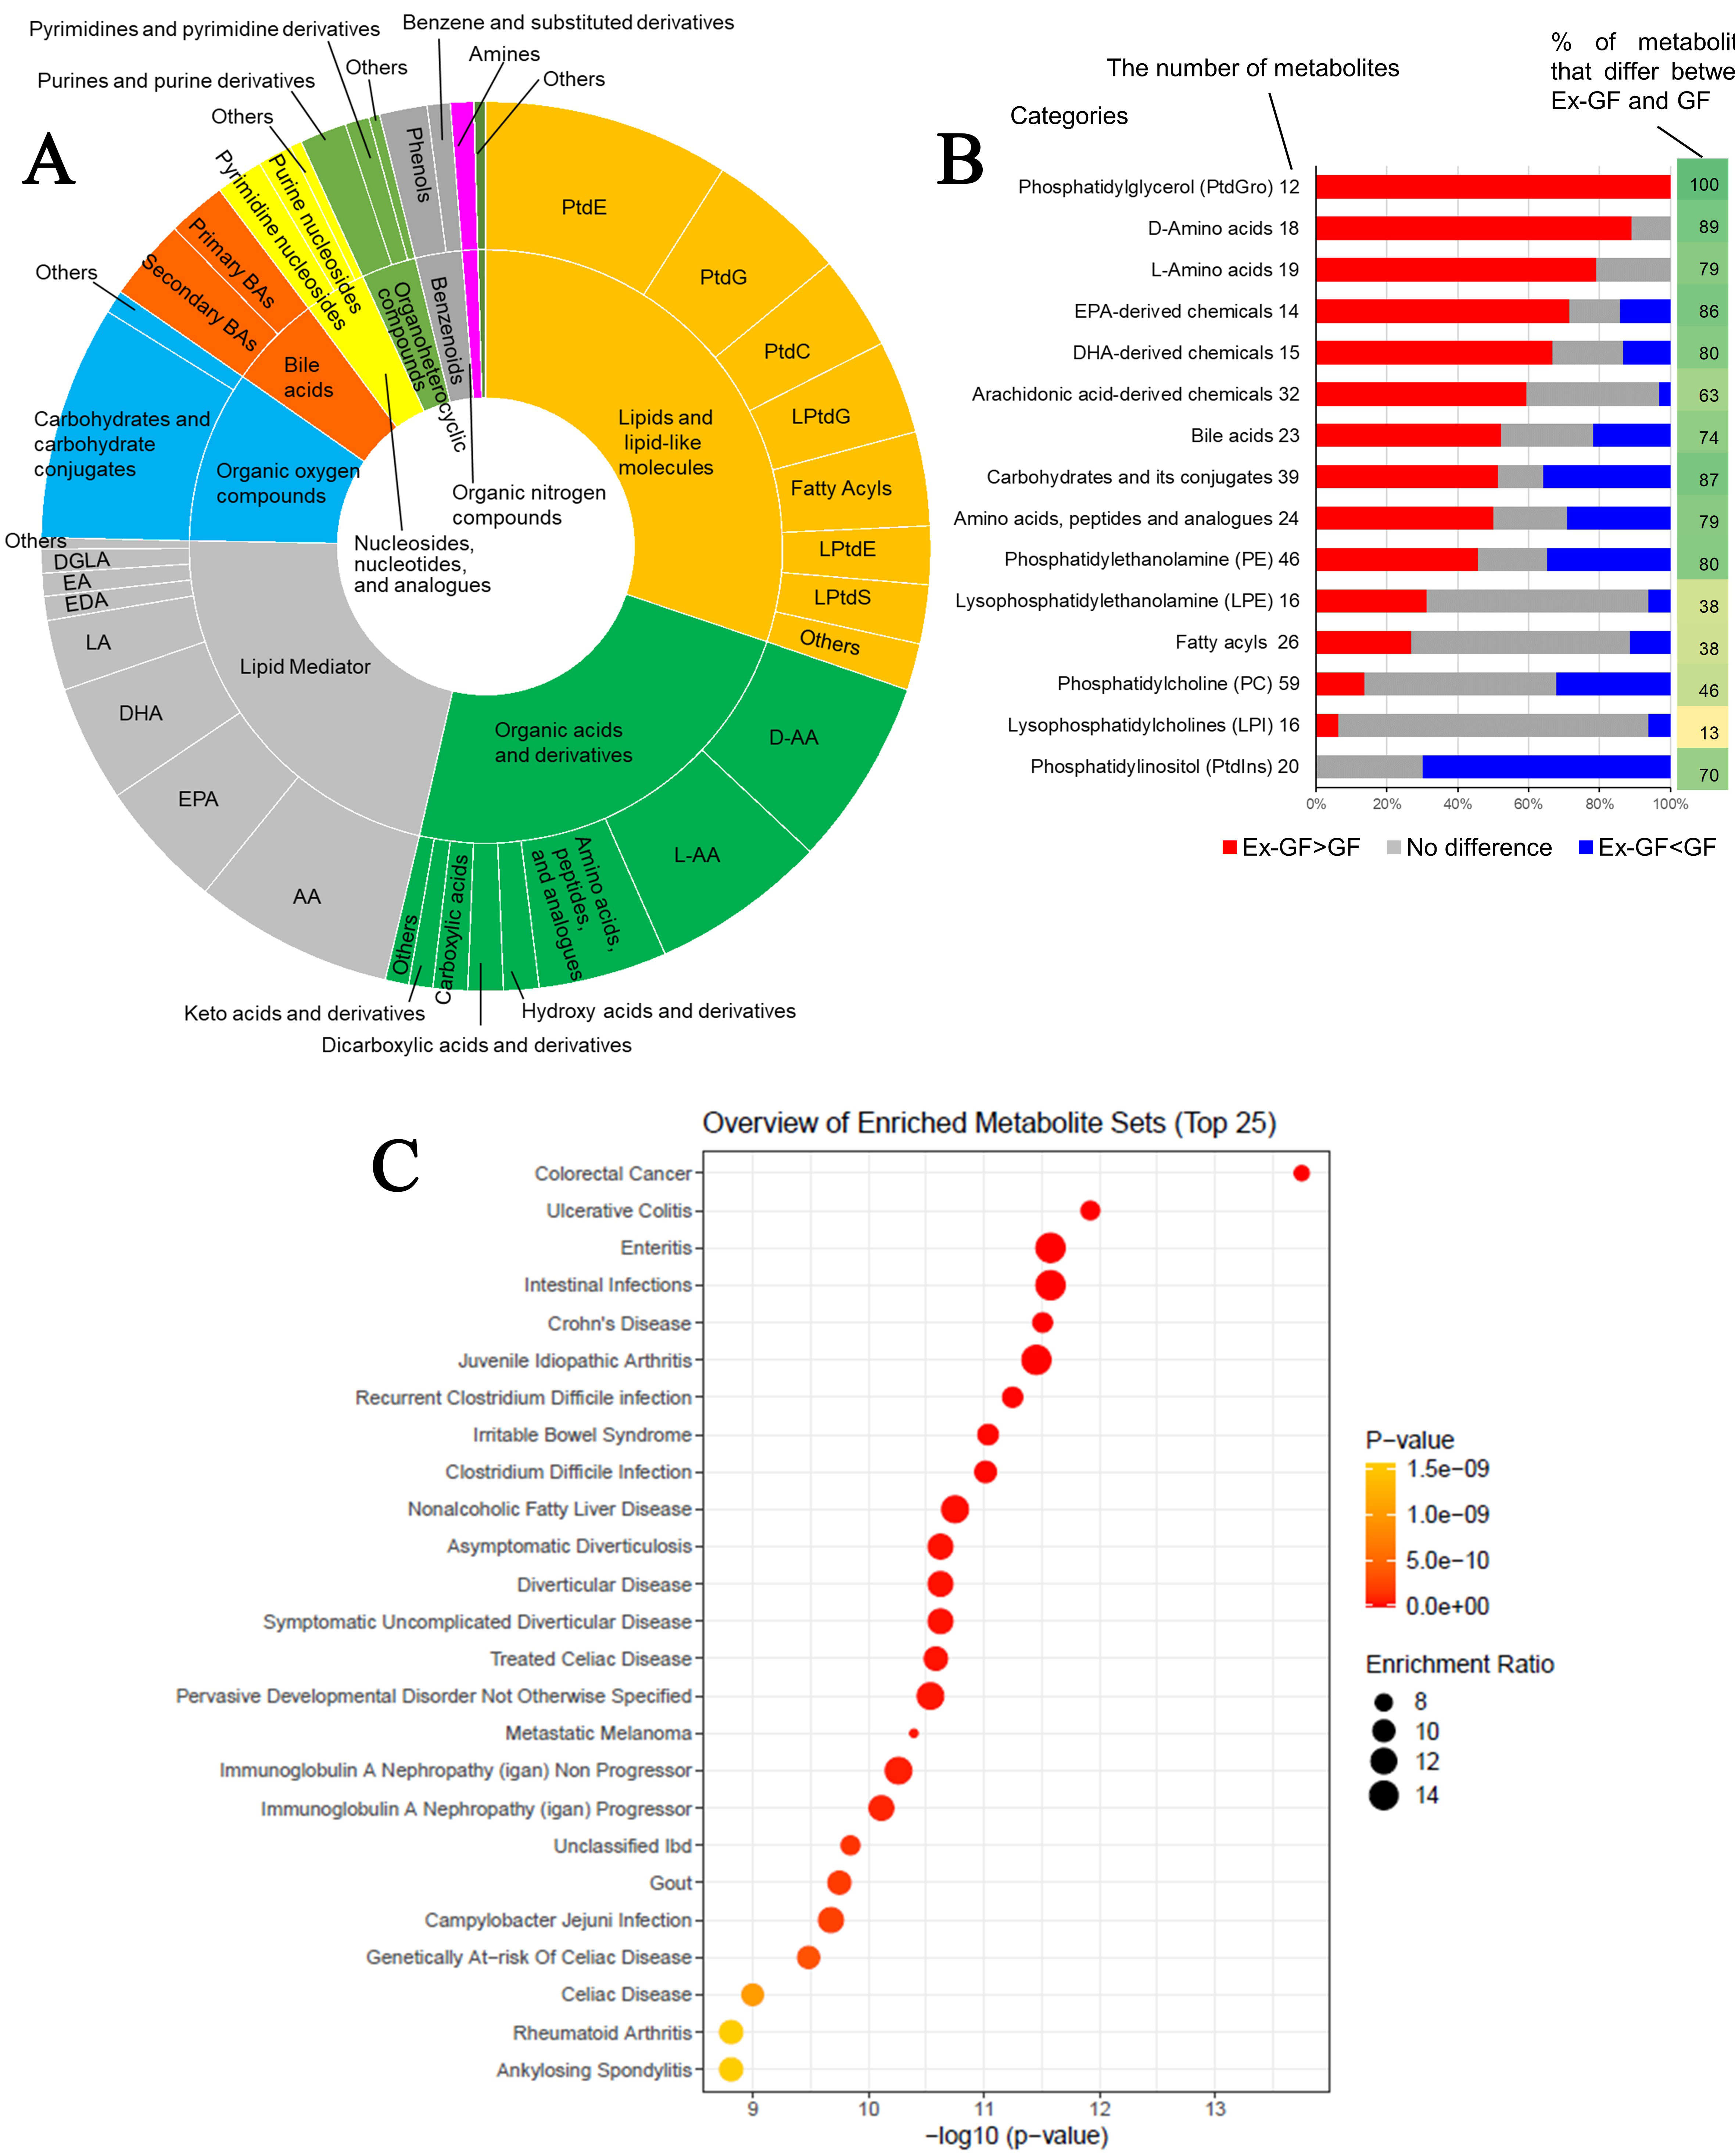
Figure 2. Data analyses of faecal metabolome derived from GF mice and Ex-GF mice. (A) Categories of metabolites whose concentrations were significantly higher in Ex-GF mice than in GF mice (n = 8/group). The number of metabolites whose concentrations were higher in Ex-GF mice than in GF mice was 235. Supplementary Figure 1 shows the categories of metabolites whose concentrations were lower in Ex-GF mice than in GF mice; (B) The proportion of metabolites increased or decreased by the intestinal microbiome in each major subclass category containing over 1% of detected metabolites. The numbers beside the category name are the number of metabolites detected by metabolomics in each category. Values on the right side of the graph are the percentage of metabolites that significantly differ between Ex-GF and GF mice; (C) Metabolite set enrichment analysis of the faecal metabolome. We identified a total of 524 metabolites, and the data of 307 of these compounds recorded in MetaboAnalyst 5.0 were utilised for analysis. For this purpose, we employed the ‘Faeces’ metabolite set library, which includes 44 metabolite sets previously documented in human faeces, to investigate disease signatures. The enrichment ratio was calculated using the formula hits/expected, where ‘hits’ refers to the observed occurrences and ‘expected’ denotes the anticipated occurrences. PtdE: Phosphatidylethanolamine; PtdG: phosphatidylglycerol; PtdC: phosphatidylcholine; PtdI: phosphatidylinositol; PtdS: phosphatidylserine; LPtdG: lysophosphatidylglycerol; LPtdE: lysophosphatidylethanolamine; LPtdS: lysophosphatidylserine; D-AA: D-amino acid; L-AA: L-amino acid; DL-AA: DL-amino acid; AA: arachidonic acid; EPA: eicosapentaenoic acid; DHA: docosahexaenoic acid; LA: Linoleic acid; EDA: eicosadienoic acid; EA: ethanolamide; DGLA: dihomo-γ-linolenic acid; GF: germ-free; Ex-GF: ex-germ-free.


