


fig1
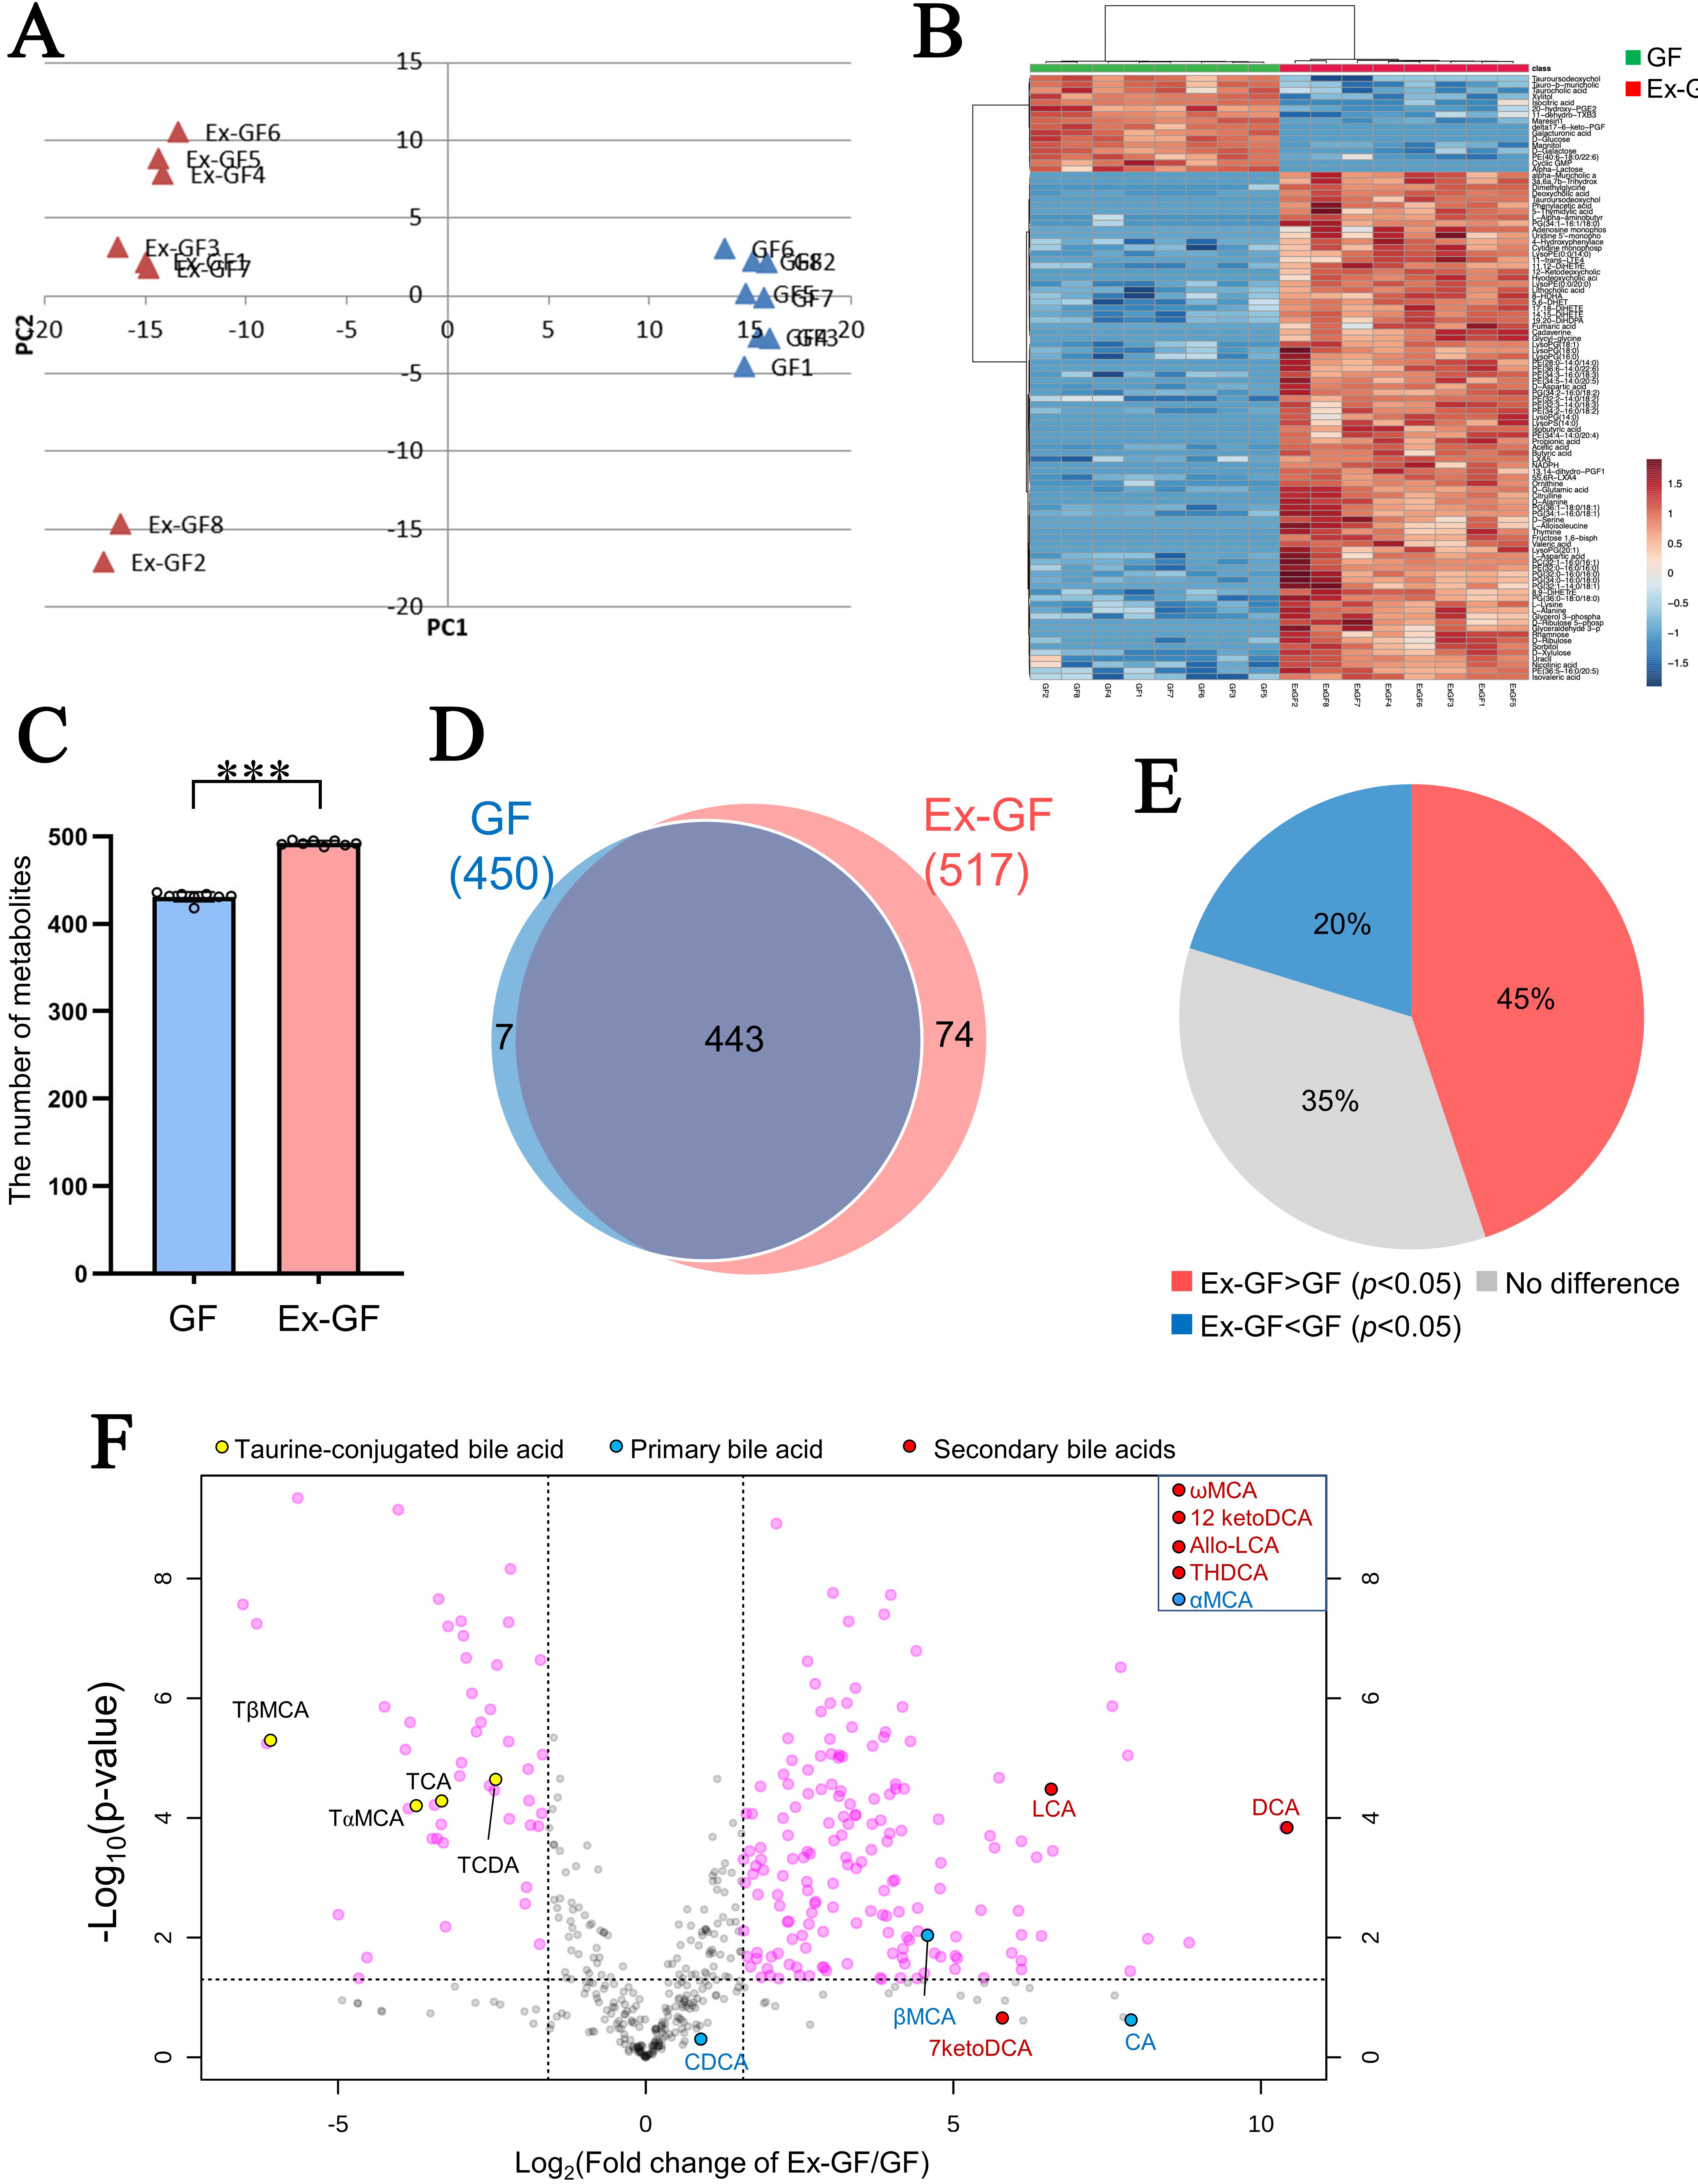
Figure 1. Difference between the faecal metabolomes of GF mice and Ex-GF mice. GF: Germ-free mice (n = 8), Ex-GF: ex-GF mice (n = 8). (A) Principal component analysis of metabolome profile; (B) Hierarchical clustering showing patterns of metabolites (top 100 chemicals based on P-value); (C) The number of metabolites detected in mouse faeces. Asterisks indicate statistical significance (***P < 0.001, Student’s t-test); (D) Venn diagram of faecal metabolites detected in Ex-GF and GF mice; (E) Percentage of metabolites: Ex-GF > GF, no difference, and Ex-GF < GF; (F) Volcano plot of metabolites between Ex-GF and GF mice. Taurine-conjugated bile acids and their metabolites are coloured. Metabolites in the square of the top-right are bile acids detected in only Ex-GF mice. TCA: Taurocholic acid; TCDA: taurochenodeoxycholic acid; TαMCA: tauro-α-muricholic acid; TβMCA: tauro-β-muricholic acid; CA: cholic acid; CDCA: chenodeoxycholic acid; αMCA: α-muricholic acid; βMCA: β-muricholic acid; DCA: deoxycholic acid; LCA: lithocholic acid; ωMCA: ω-muricholic acid; 7ketoDCA: 7-ketodeoxycholic acid; 12ketoDCA: 12-ketodeoxycholic acid; Allo-LCA: allolithocholic acid; THDCA: trihydroxydeoxycholic acid; GF: germ-free; Ex-GF: ex-germ-free.


