


fig2
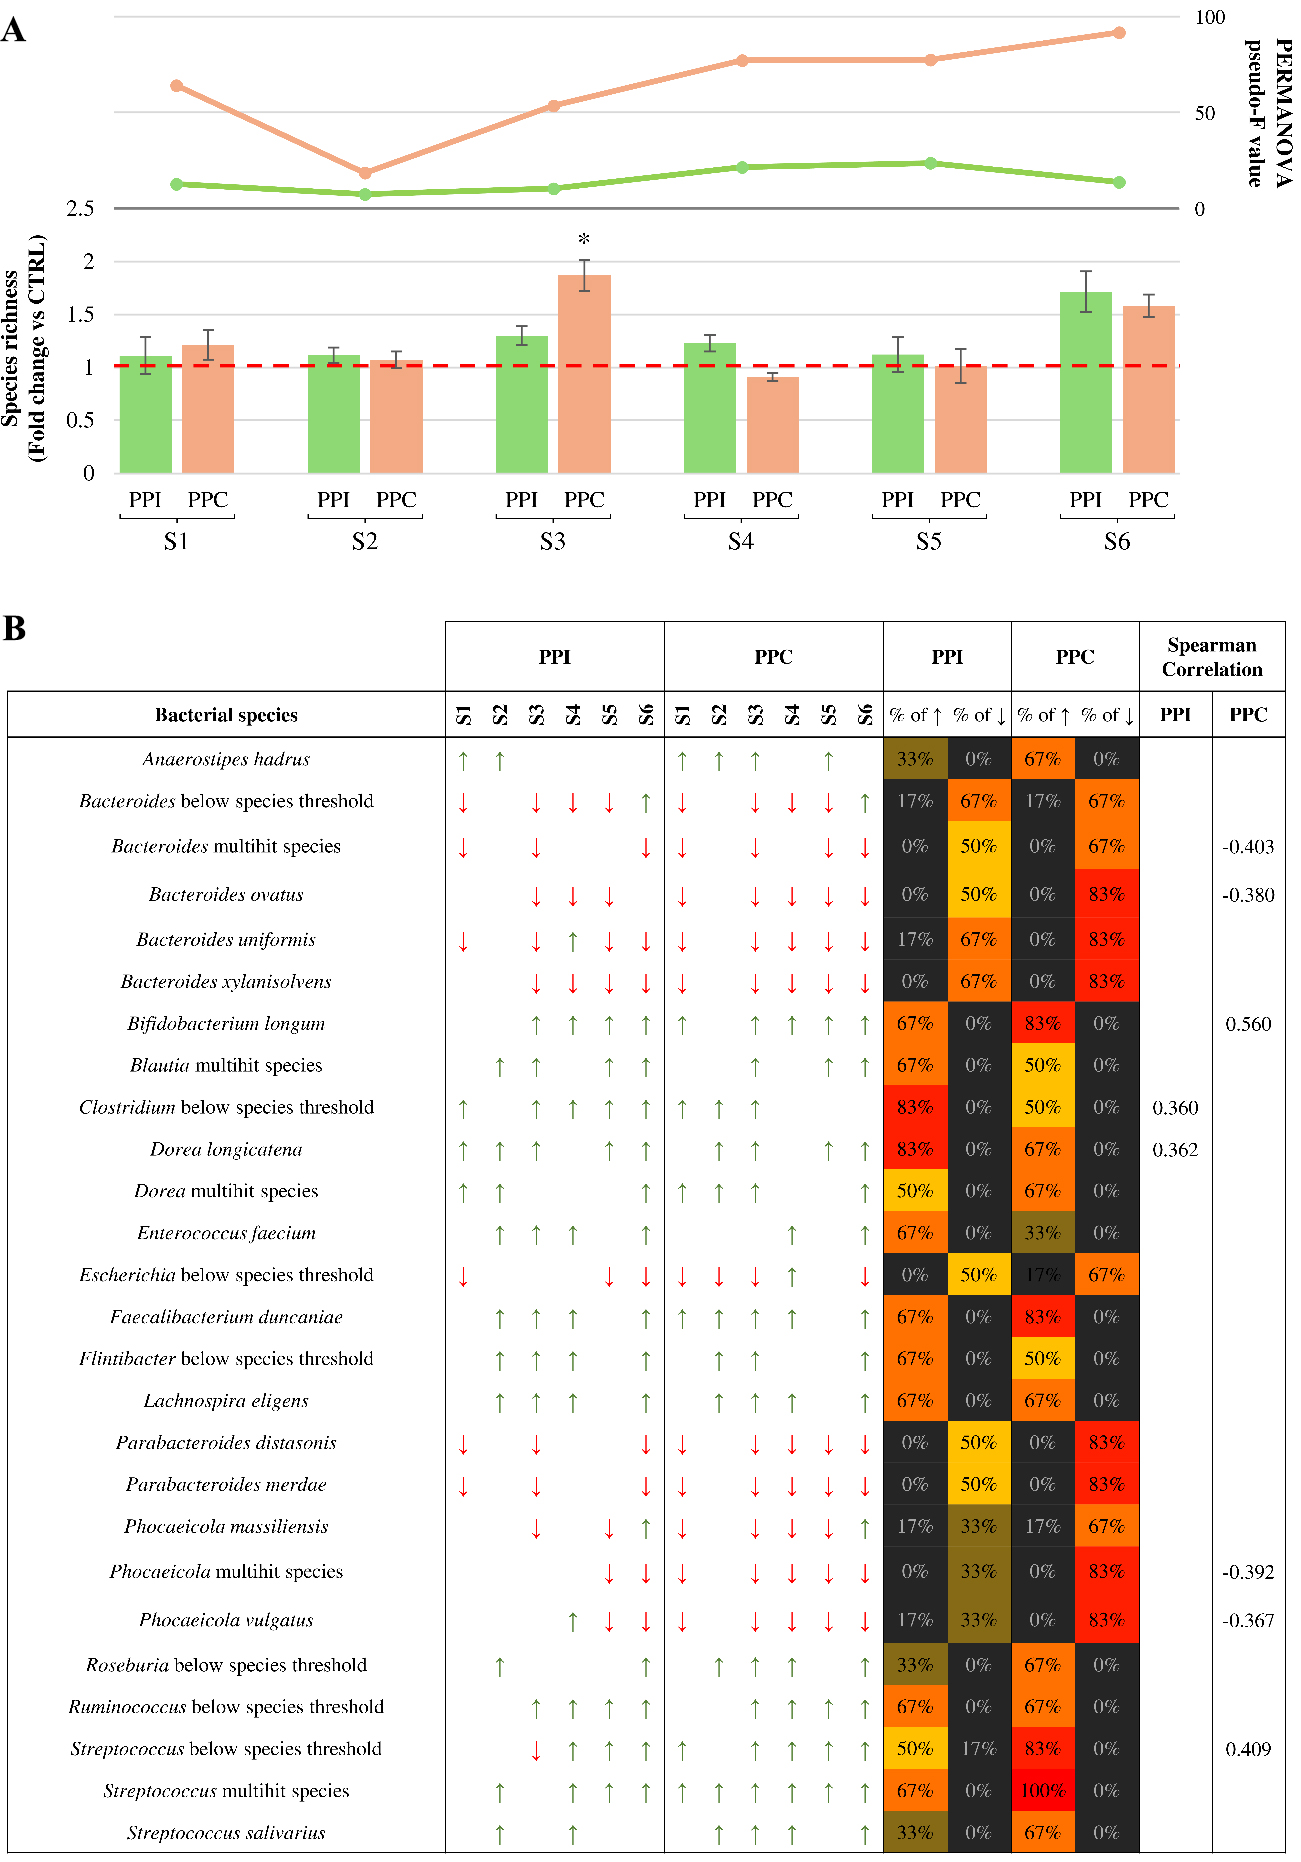
Figure 2. Microbiota-level response to pea-derived protein preparations. (A) Fold change in microbial species richness after 24 h of anaerobic cultivation with PPI (green bars) or PPC (orange bars), compared to the control. The red dashed line marks the fold change value of 1, indicating no variation relative to the control. Error bars represent propagated standard deviations across biological replicates. The two-line graphs above the bars represent the pseudo-F values obtained by PERMANOVA analysis, comparing the overall microbial community structure between each protein preparation and its respective control for each microbiota sample; (B) All bacterial species that showed a relevant change in abundance following treatment. Arrows indicate directionality of variation, with red downward arrows for a fold change below 0.5 and green upward arrows for a fold change above 2. Colored bars on the right indicate the percentage of microbiota samples in which each taxon showed an increase (↑) or decrease (↓) in relative abundance following supplementation to PPI or PPC. Cell colors follow a gradient from black (lowest prevalence) to red (highest prevalence). The final column displays the significant Spearman correlations (P-value < 0.05) between taxon abundance and protein supplementation across the six microbiota samples. PPC: Pea protein concentrate; PPI: pea protein isolate; S1-S6: samples 1-6; PERMANOVA: permutational multivariate analysis of variance; peseudo-F: the pseudo-F statistic from PERMANOVA analysis.


