


fig1
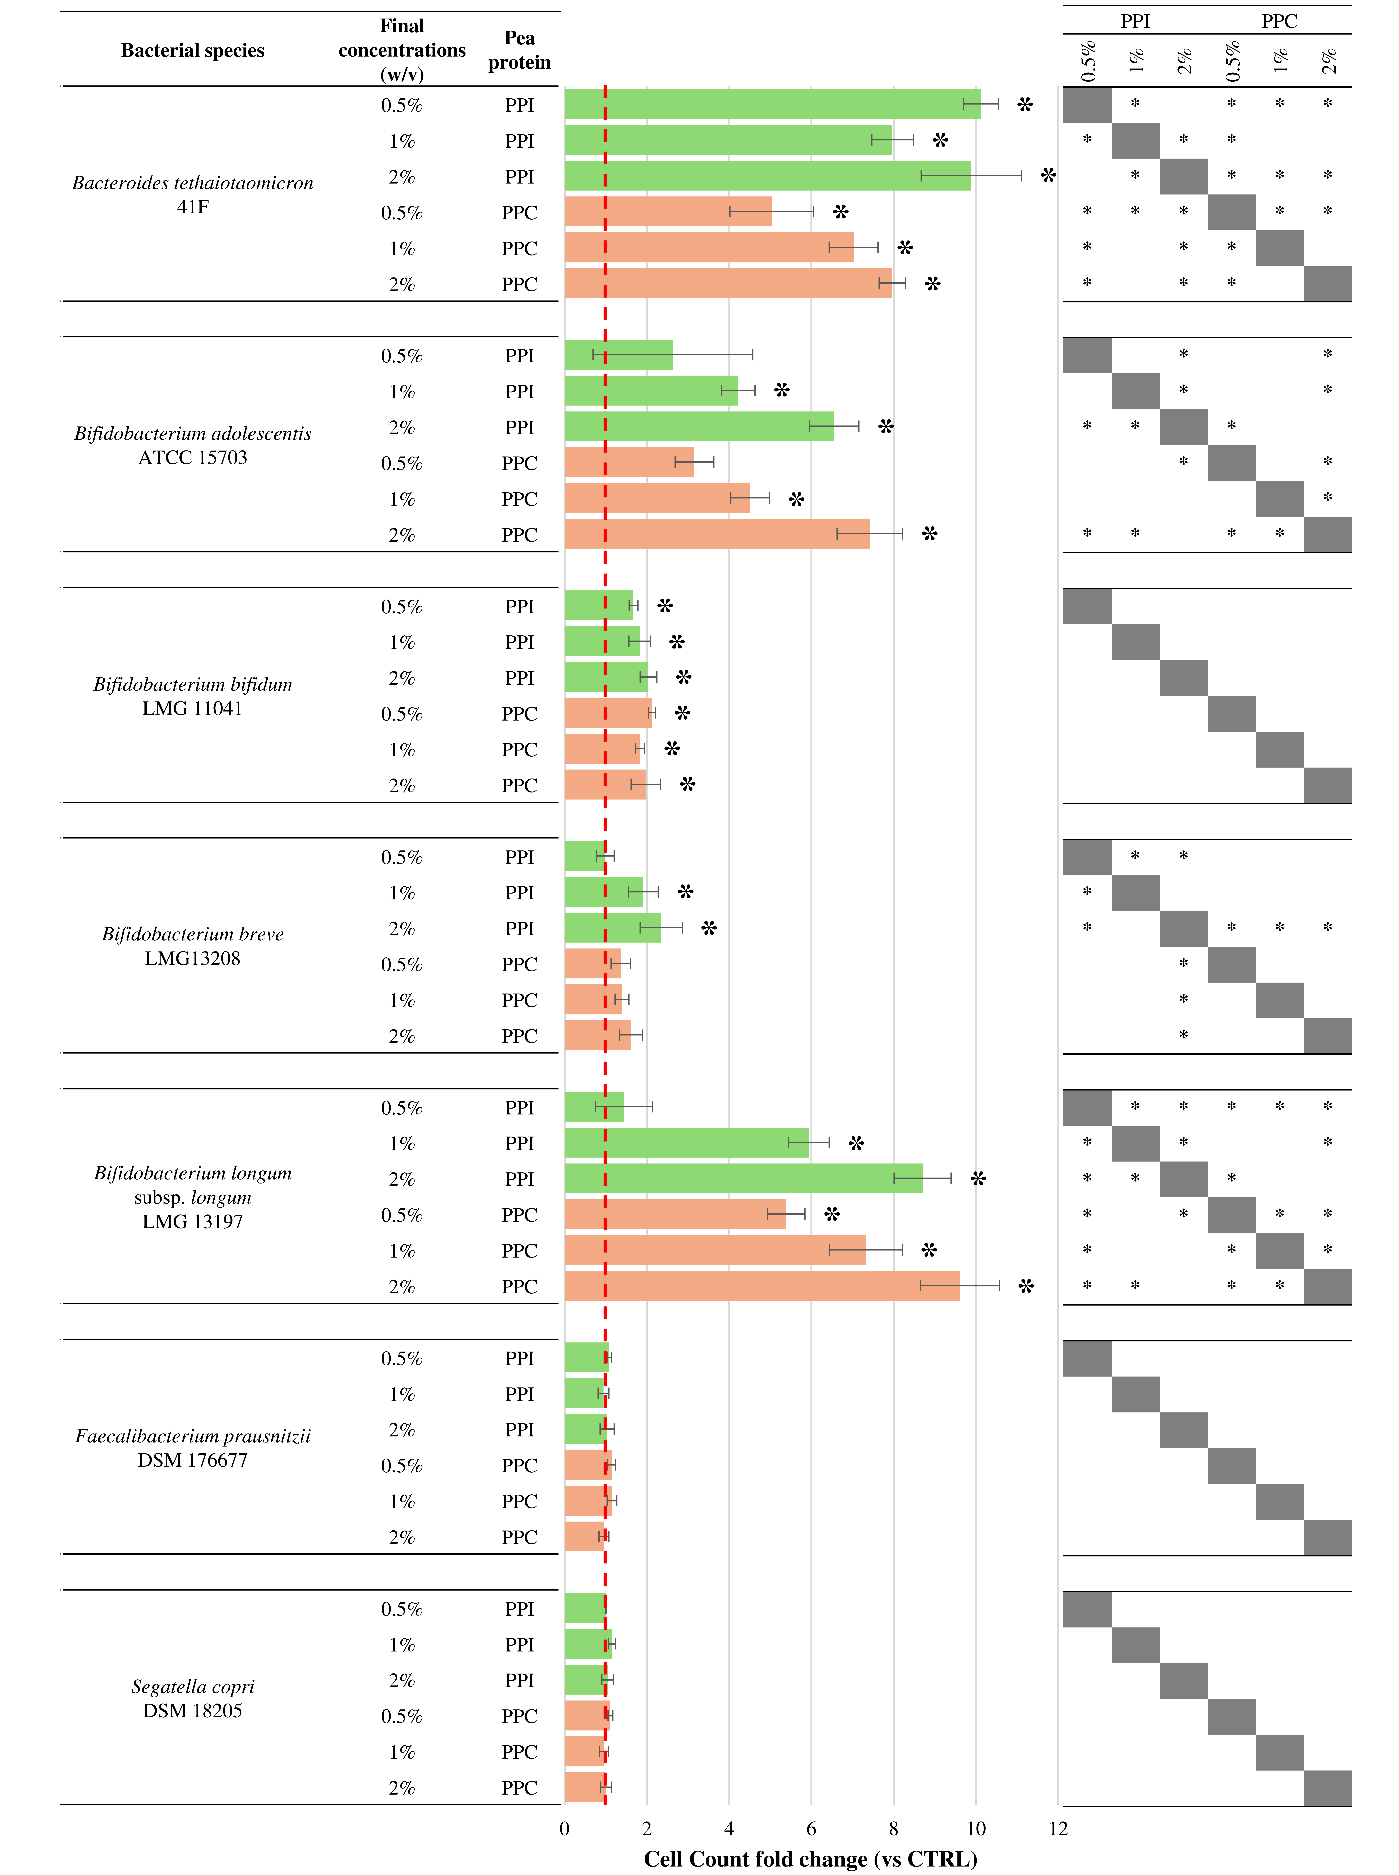
Figure 1. Growth response of selected intestinal bacterial strains to pea protein preparations. The bar plots display the fold change in cell count after 24 h of anaerobic incubation with increasing concentrations (0.5%, 1%, and 2% w/v) of PPI (green bars) and PPC (orange bars), relative to the untreated control. The dashed red line represents the fold change value of 1, corresponding to control levels. Error bars represent propagated standard deviations across biological replicates. Asterisks (*) indicate statistically significant differences compared to the control (Kruskal-Wallis test, P < 0.05). The table on the right summarizes the results of pairwise comparisons between PPI and PPC at the same concentrations. Asterisks (*) indicate statistically significant differences between the two protein preparations (Kruskal-Wallis test, P < 0.05). PPC: Pea protein concentrate; PPI: pea protein isolate; ATCC: American Type Culture Collection; LMG: Laboratorium voor Microbiologie Gent Culture Collection; DSM: Deutsche Sammlung von Mikroorganismen und Zellkulturen; CTRL: control.


