


fig7
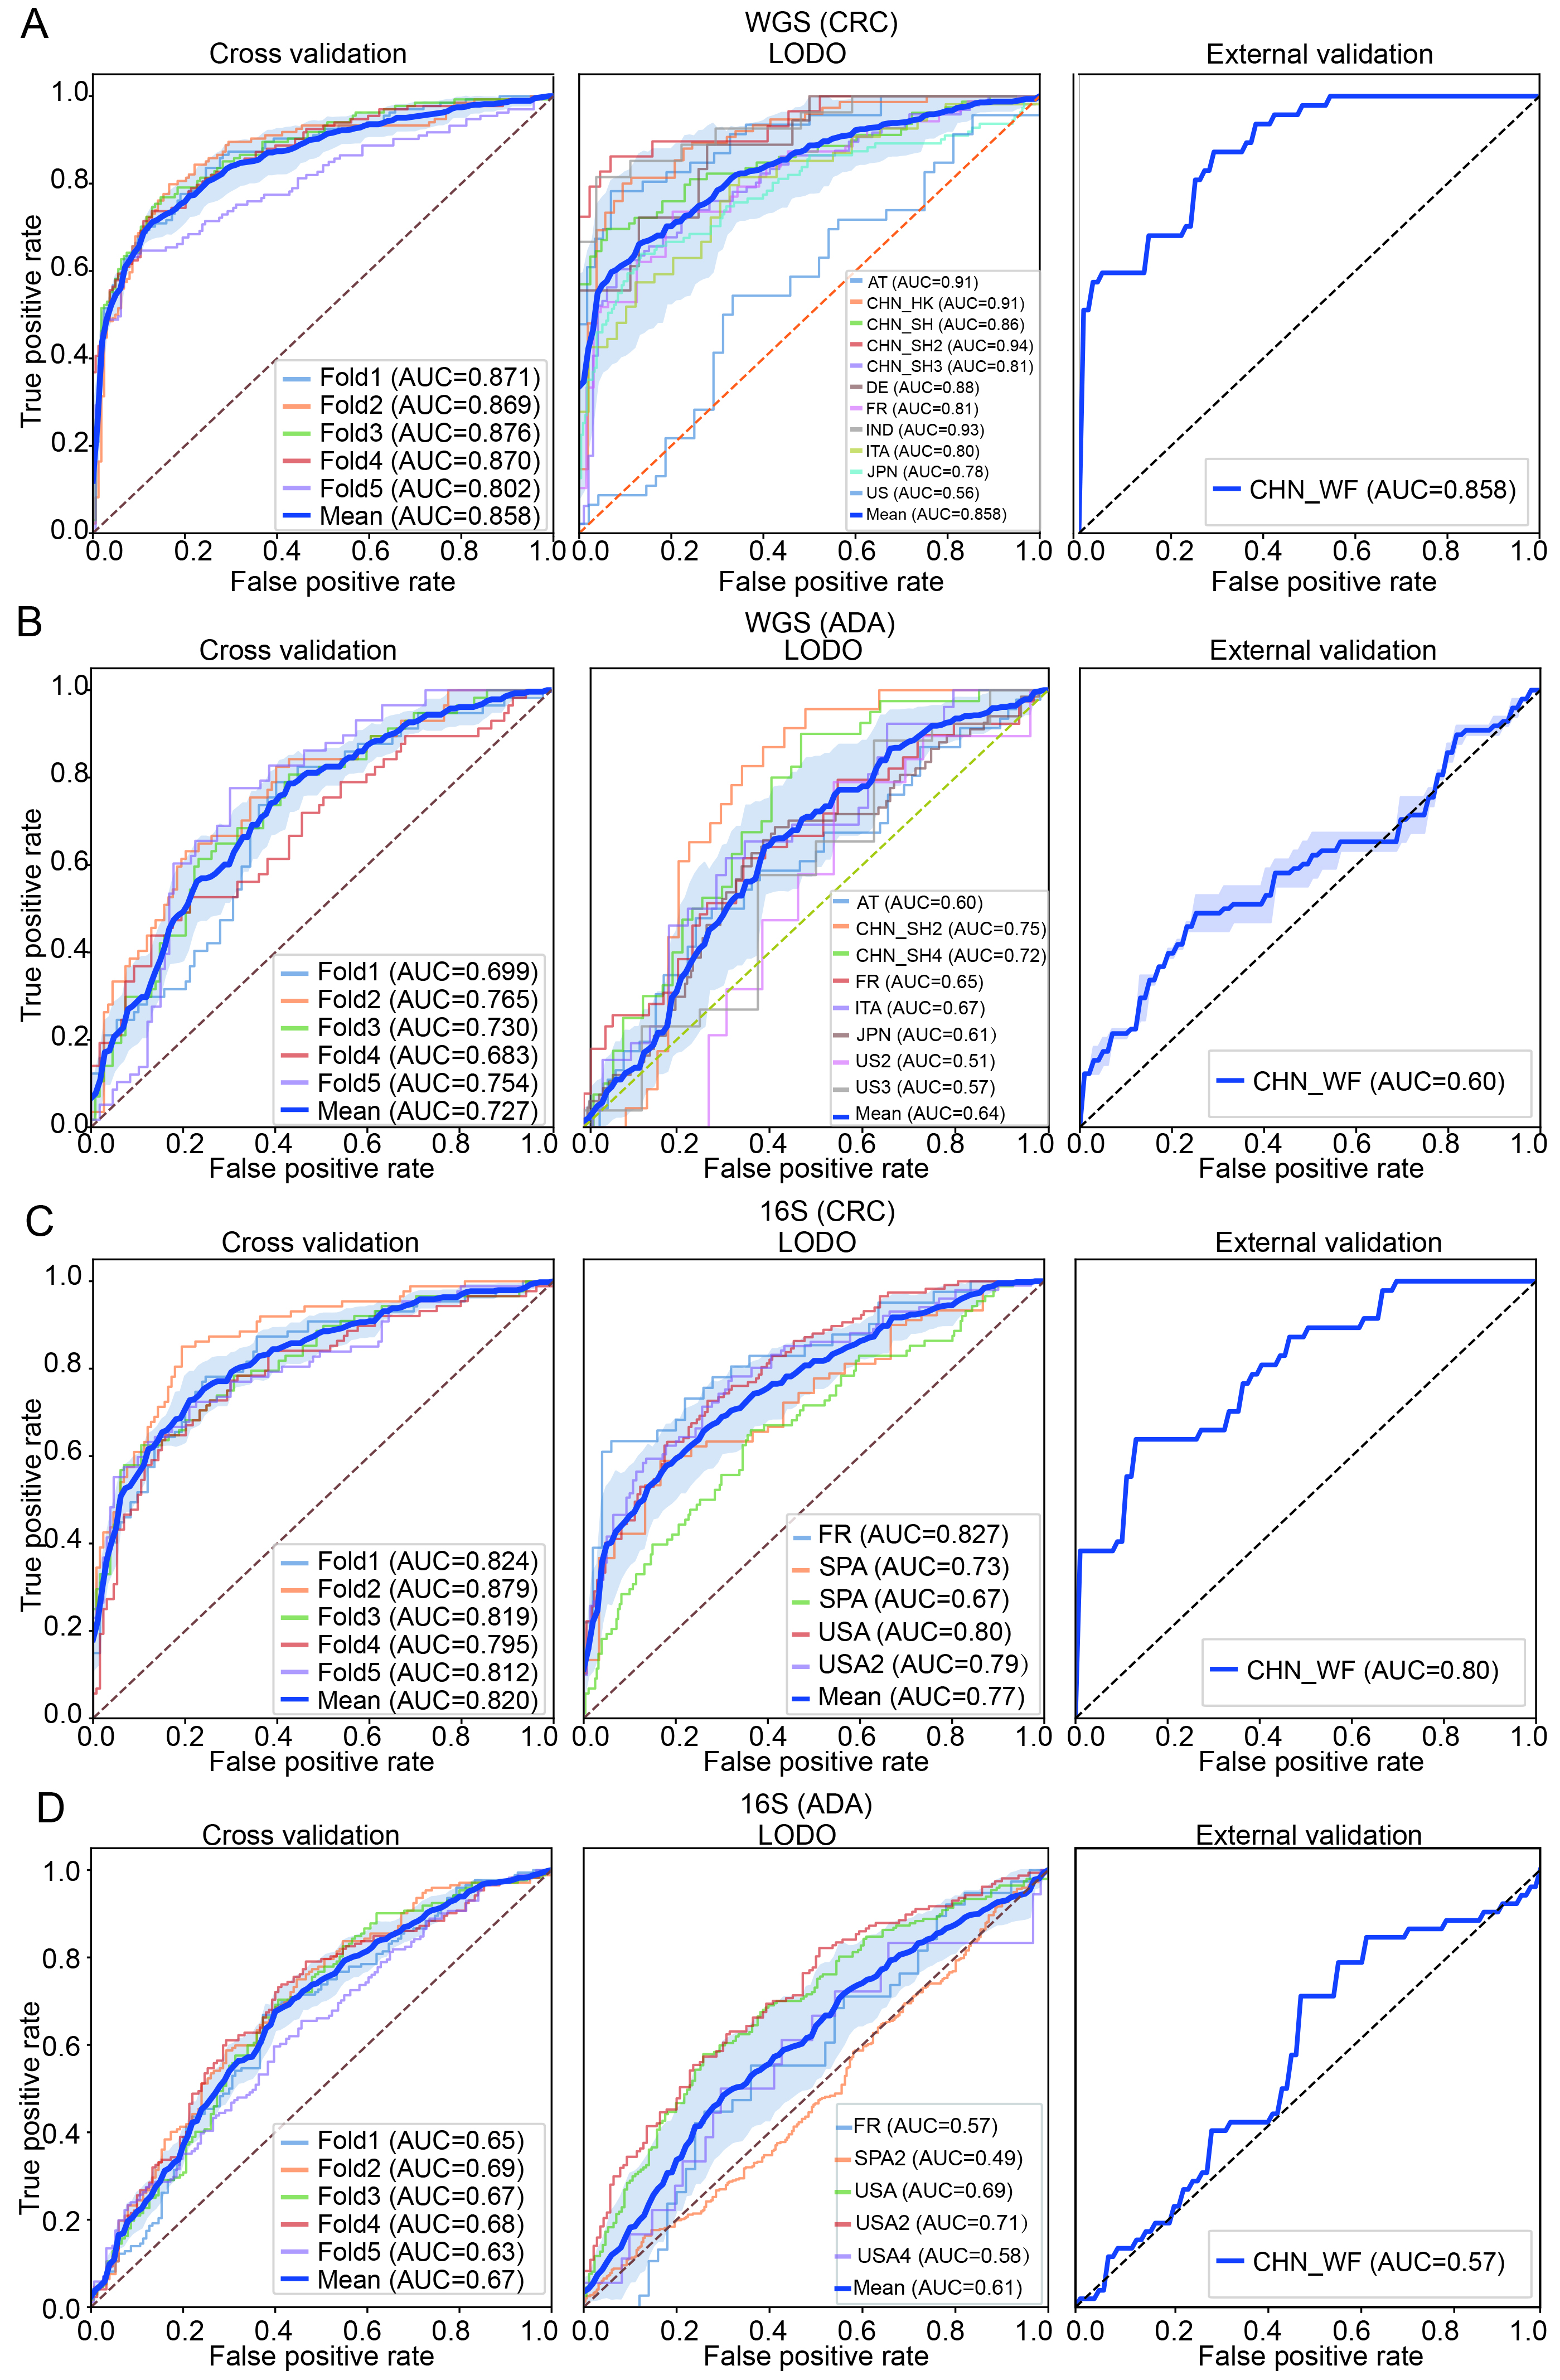
Figure 7. Construction and validation performance analysis of the optimal machine learning pipeline. (A and B) Classification performance evaluations of CRC and ADA based on WGS data, respectively; (C and D) Evaluation results of CRC and ADA based on 16S data, respectively. Each sub-figure shows the ROC curves under three validation strategies: five-fold cross-validation (left), LODO validation (middle), and performance on an independent validation set (right). AT: Austria; CHN: China; DE: Germany; ITA: Italy; JPN: Japan; IND: India; FR: France; SPA: Spain; US: United States; WGS: whole genome sequencing; CRC: colorectal cancer; ADA: adenoma; 16S: 16S rRNA gene sequencing; AUC: area under the curve; LODO: Leave-One-Dataset-Out.


