


fig4
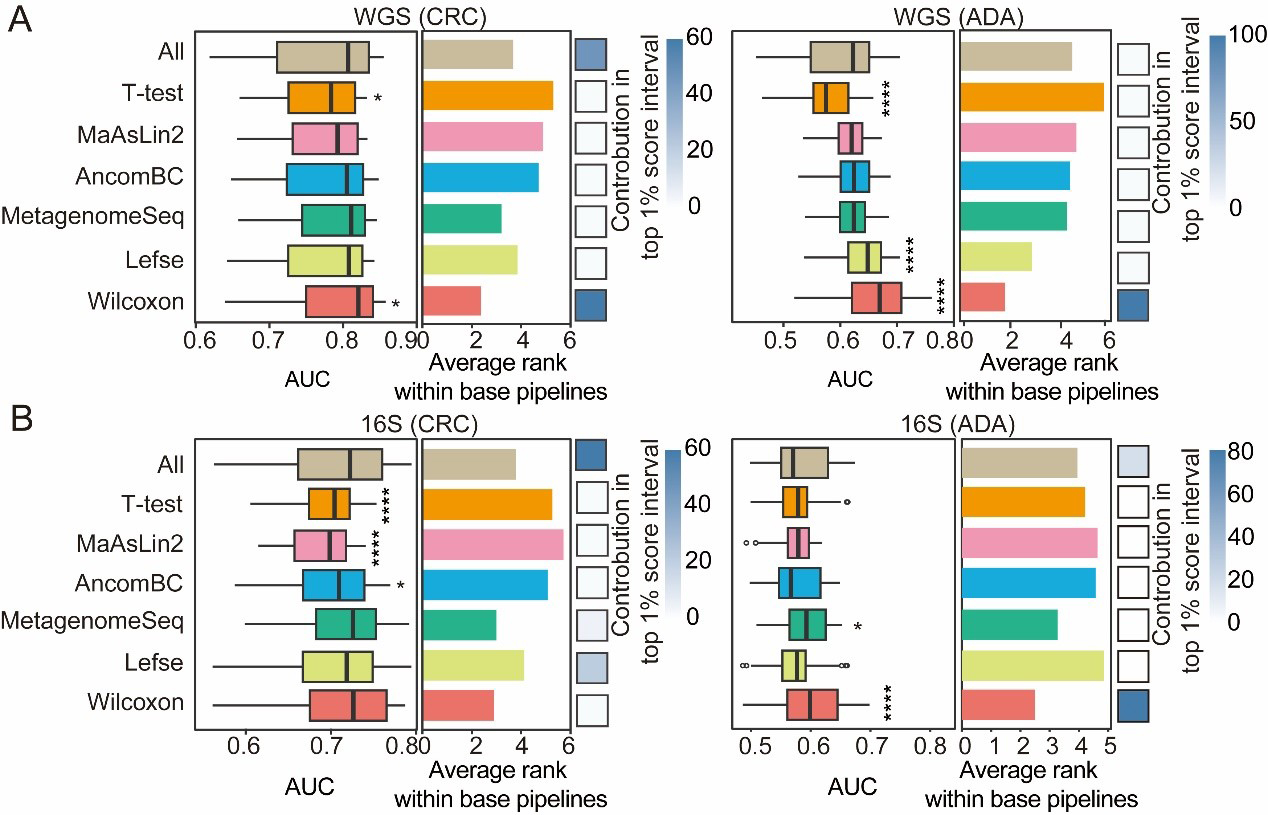
Figure 4. Performance comparison of feature selection strategies. For both CRC and ADA detection based on (A) WGS and (B) 16S data, this figure evaluates seven feature selection strategies across 1,512 base pipelines. The left and middle panels respectively plot the distribution of AUC scores and the average performance ranking for each strategy. The contribution of each strategy to the top 1% of processes is shown in the heat map in the right panel. Fisher’s exact test was employed to calculate the significance of this enrichment (P-values are indicated as follows: NS > 0.05; * < 0.05; and **** < 0.0001). Source data is available in Supplementary dataset. WGS: Whole genome sequencing; CRC: colorectal cancer; ADA: adenoma; 16S: 16S rRNA gene sequencing; AUC: area under the curve; MaAsLin2: multivariable association with linear models 2; AncomBC: analysis of composition of microbiomes with bias correction; MetagenomeSeq: MetagenomeSeq (zero-inflated Gaussian model toolkit); Lefse: linear discriminant analysis effect size.


