


fig6
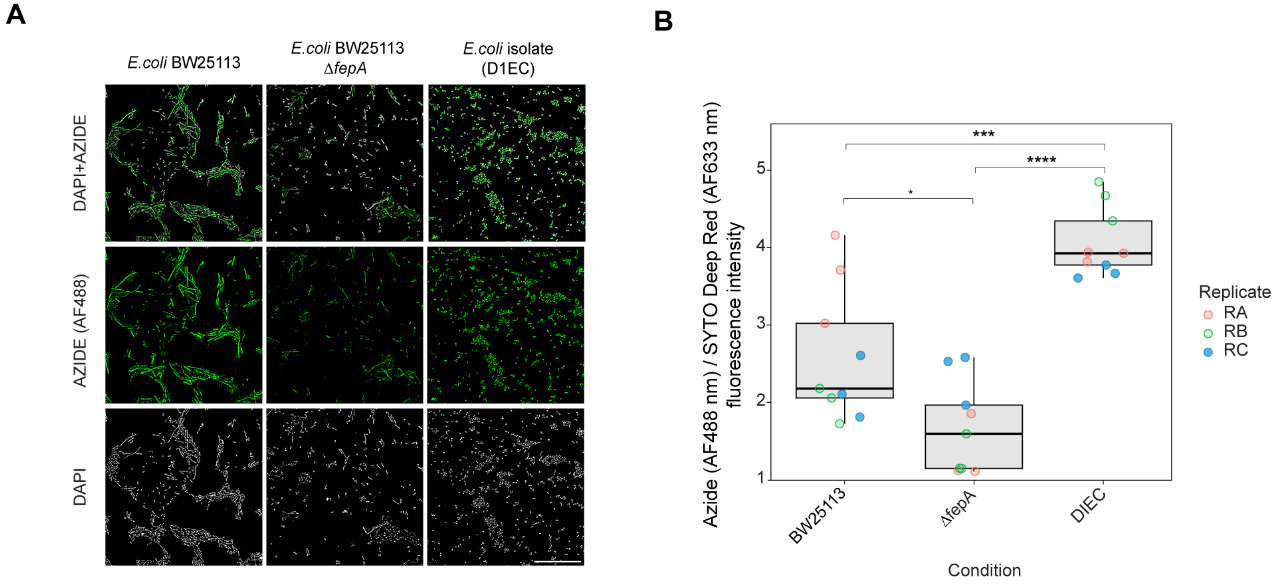
Figure 6. Identification of molecular determinants of entacapone accumulation in E. coli. (A) Microscopy images showing the interaction of EB-11-24 with E. coli BW25113, BW25113 ΔfepA, and an E. coli gut isolate (termed DIEC), isolated from ED01. Images were acquired using a 100× oil immersion objective with a fluorescence exposure time of 429 ms, for all samples. Scale bar: 50 µm; (B) Boxplots display background-corrected, SYTO-normalised azide fluorescence intensities in the three bacterial strains shown in A, measured on a plate well using a plate reader. Each point represents a technical replicate, with three technical replicates and three biological replicates analysed for each E. coli strain (n = 9); samples are color-coded by biological replicate. Boxes represent the interquartile range (IQR), with horizontal lines indicating the median; whiskers extend to 1.5× the IQR. Jittered points depict within-group variability. Statistical significance was assessed by one-way ANOVA (overall P-value shown), followed by pairwise comparisons using the Wilcoxon test with Benjamini-Hochberg correction. Significance levels: **** P < 0.0001, *** P < 0.001, * P < 0.05. E. coli: Escherichia coli.


