


fig4
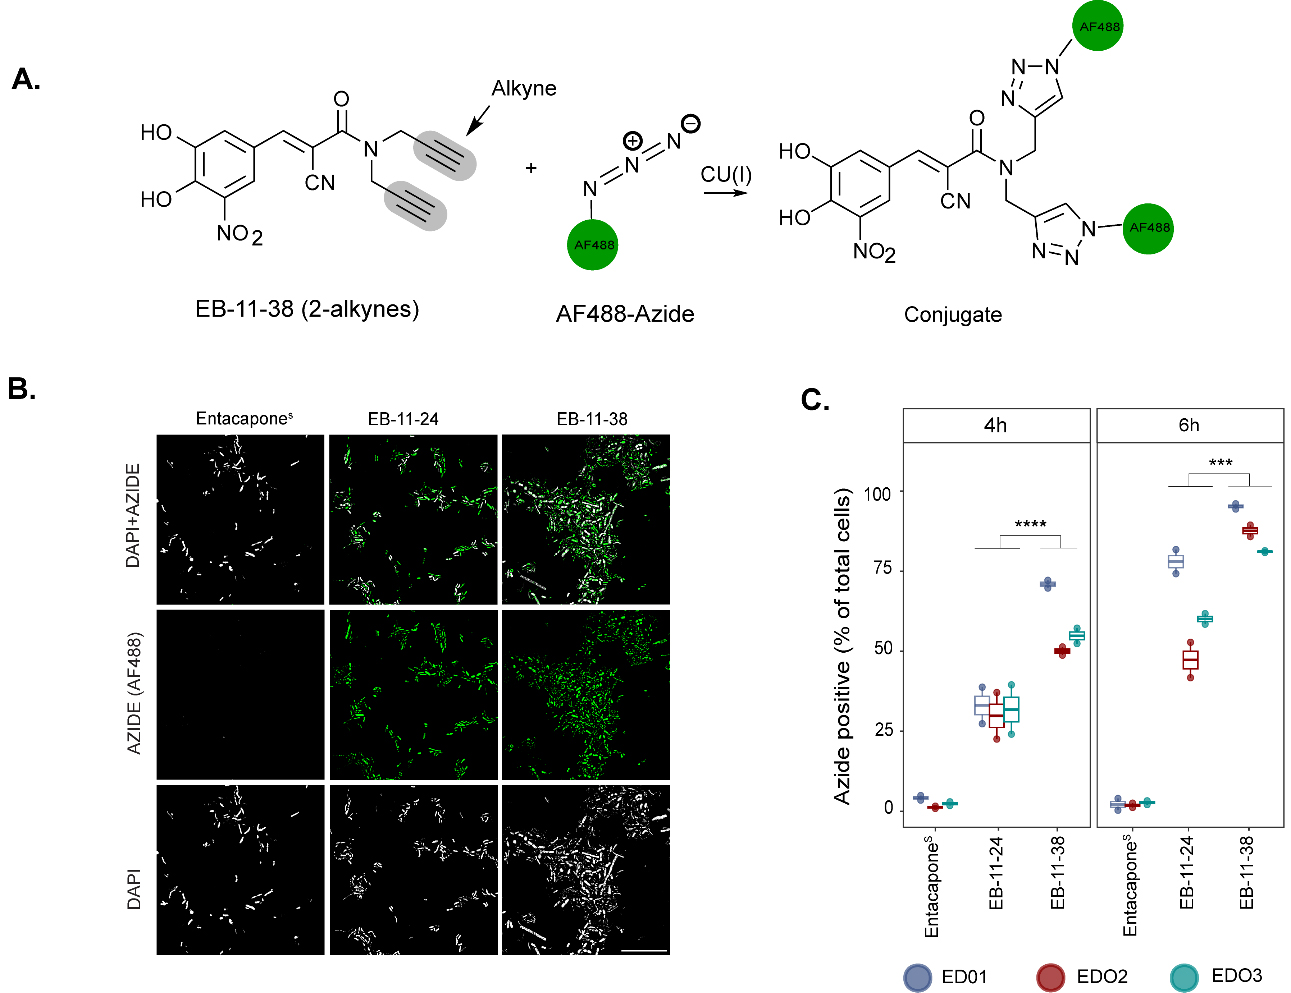
Figure 4. Click chemistry of alkyne-tagged entacapone enables tracking of drug incorporation at single-cell resolution. (A) The schematic representation shows copper-catalysed conjugation of entacapone alkyne derivatives with an AF488-labelled azide; (B) Microscope images showing AF488 signal. DAPI and AF488 azide fluorescence signals are shown in grey and green, respectively. Scale bar: 30 µm; (C) Box plot depicting the percentage of AF488-labelled microbial cells, indicating accumulation of the derivatives, colour coded by donor, at 2 incubation time points (4 h and 6 h). Data points represent replicates for each of the three donors per drug condition (n = 6 for each drug condition). Statistical significance between drug conditions was assessed using a Tukey’s post-hoc test following ANOVA. The comparison between EB-11-24 and EB-11-38 resulted in a P-value of < 0.05 at both timepoints. All comparisons were made with a 95% confidence interval. AF: Alexa Fluor; ANOVA: analysis of variance.


