


fig3
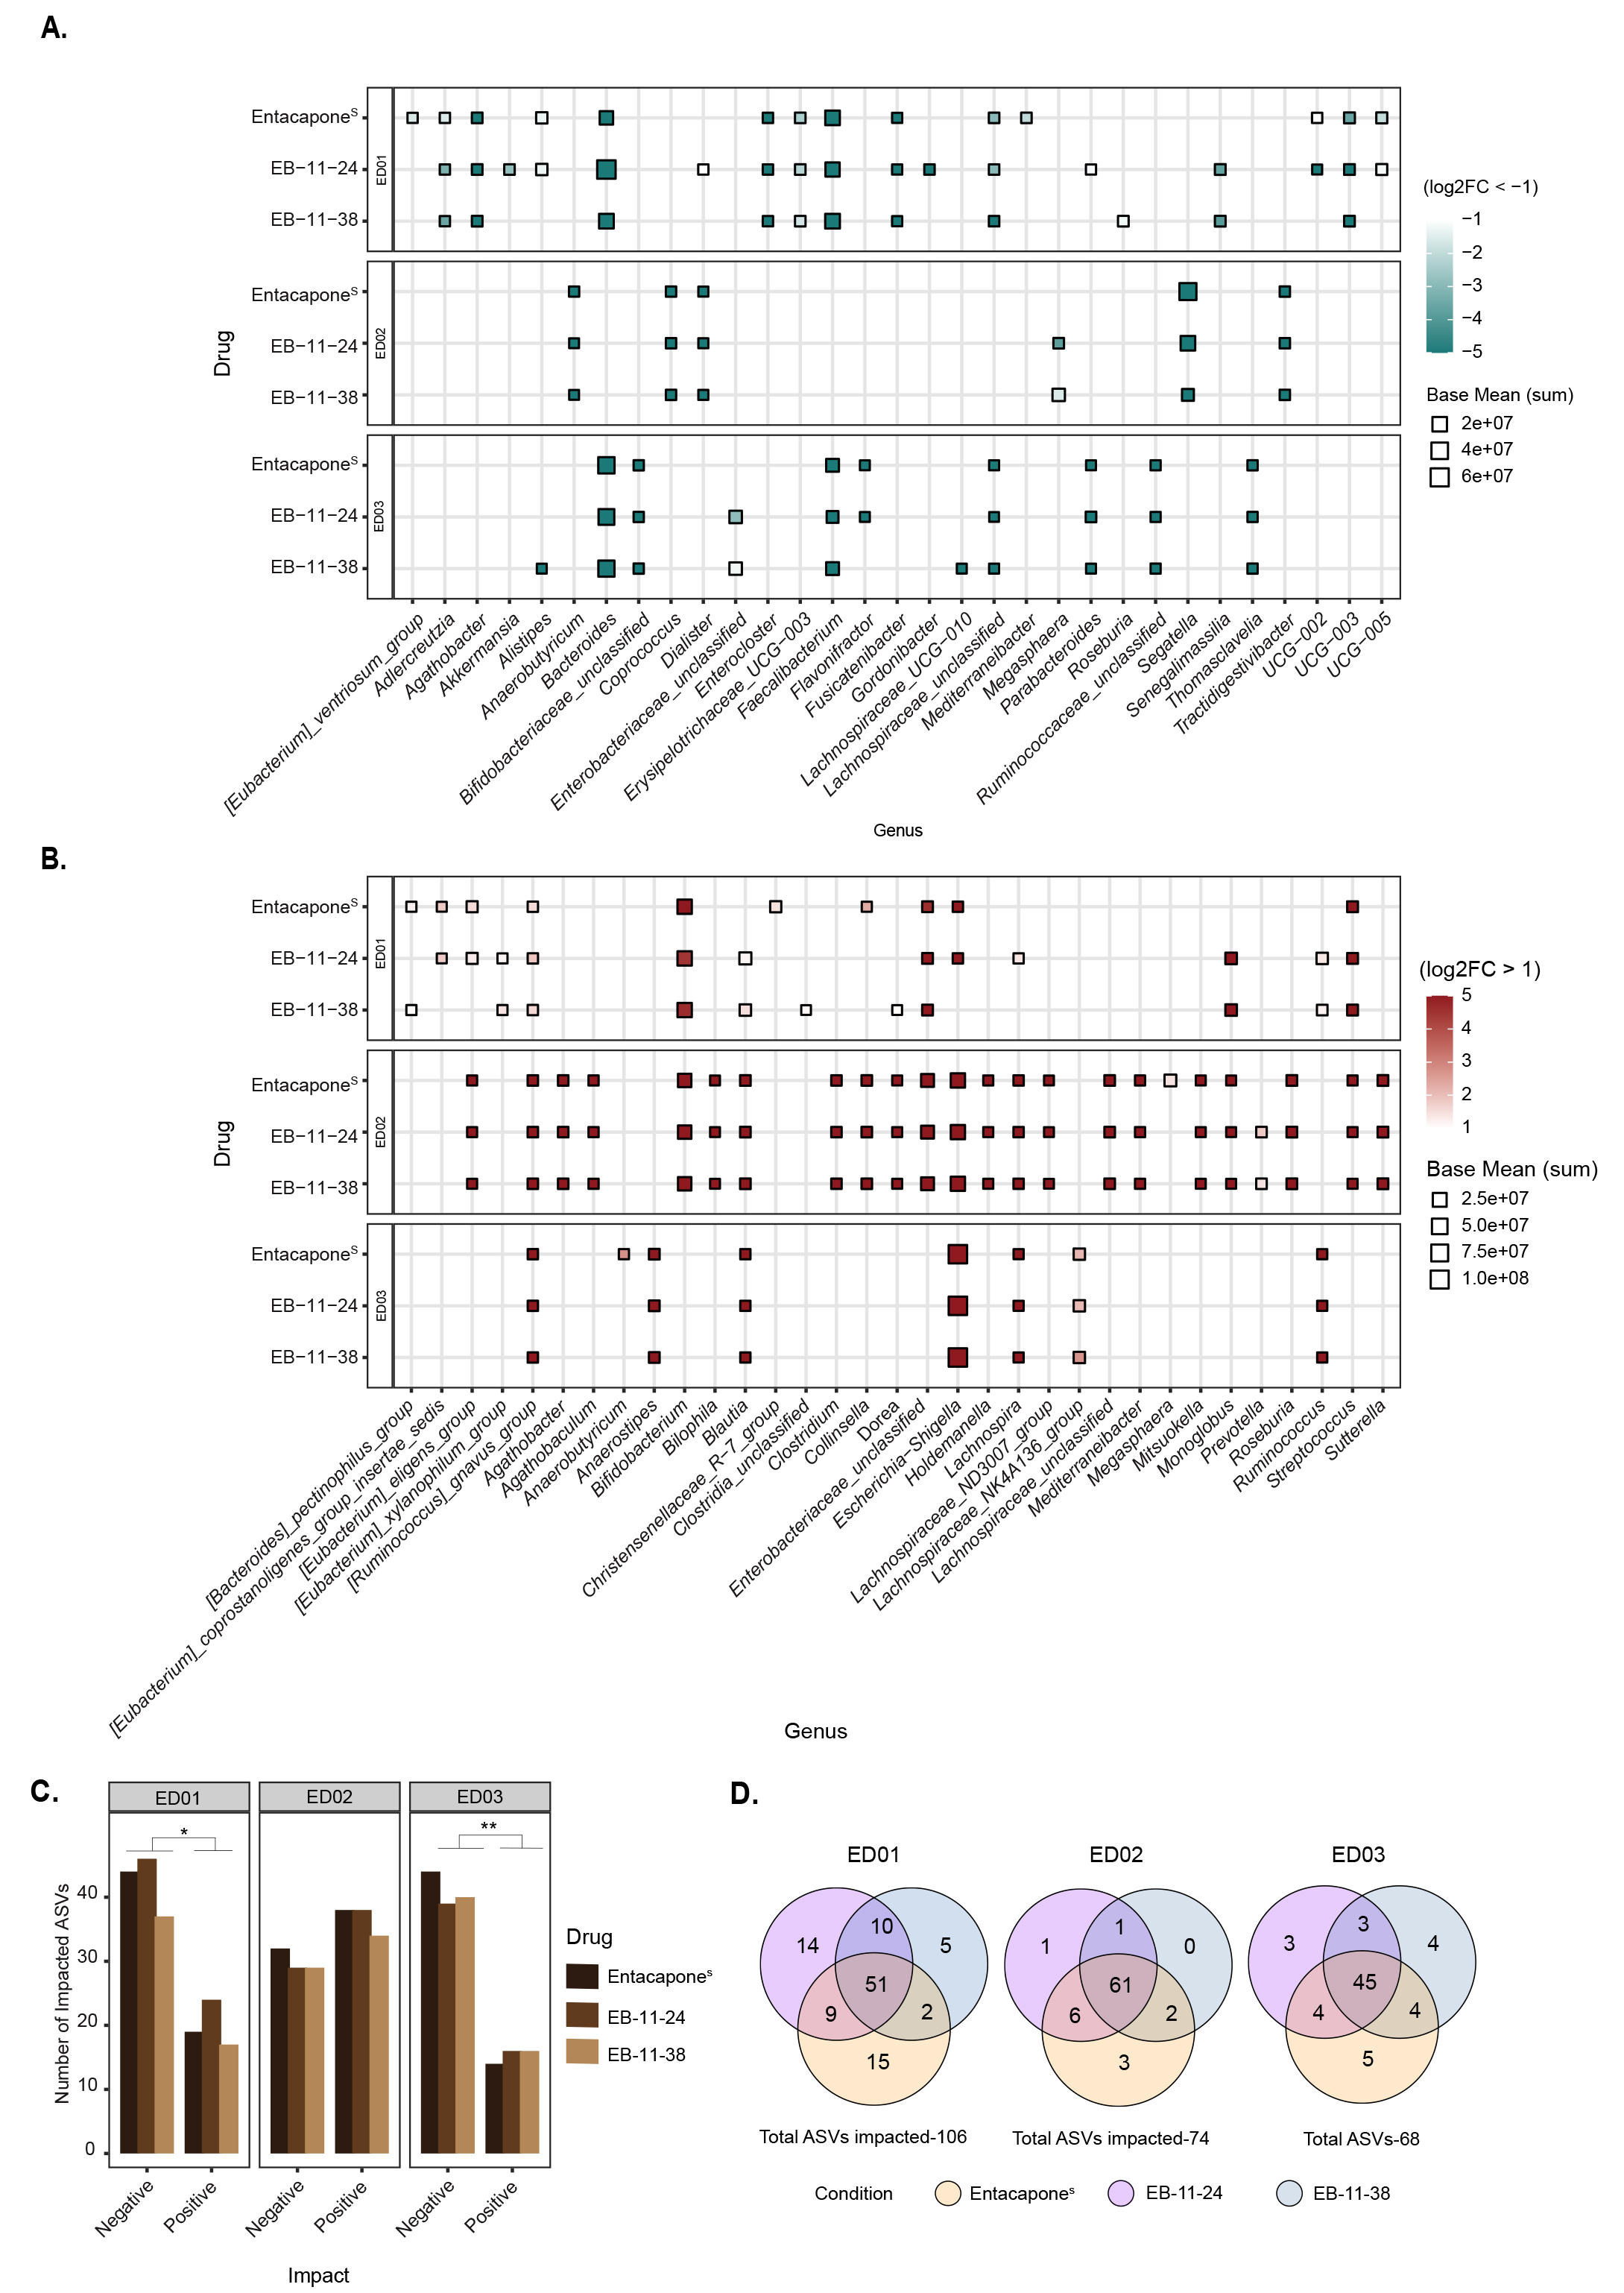
Figure 3. Faecal microbial taxa significantly affected by entacapone and its derivatives. (A) Heatmap depicting genera differentially abundant across treatment conditions (entacaponeS, EB-11-24, EB-11-38) for each donor, faceted by rows. The x-axis represents microbial genera that were significantly decreased under each treatment compared to no-drug (log2FC < -1, Padjusted < 0.05, DESeq2 analysis), while the y-axis represents the respective treatment; (B) Genera that were significantly increased in abundance under each treatment condition relative to the no-drug control (log2FC > 1, Padjusted < 0.05, DESeq2 analysis), across all donors. In A and B, point size indicates the average abundance (base mean), and colour represents log2FC with values capped at < -5 and > 5 to enhance visual clarity. “i.s.”: incertae sedis; (C) Bar plot depicting the number of ASVs either positively or negatively affected by each treatment across individual donors. The x-axis indicates the direction of impact, while the y-axis represents the number of significantly affected ASVs. Bars are coloured by drug treatment; (D) Venn diagrams illustrating the number of affected ASVs unique to entacaponeS (yellow), EB-11-24 (purple), EB-11-38 (blue), and shared between the conditions. Total ASV counts per donor are indicated. ASV: Amplicon sequence variant.


