


fig2
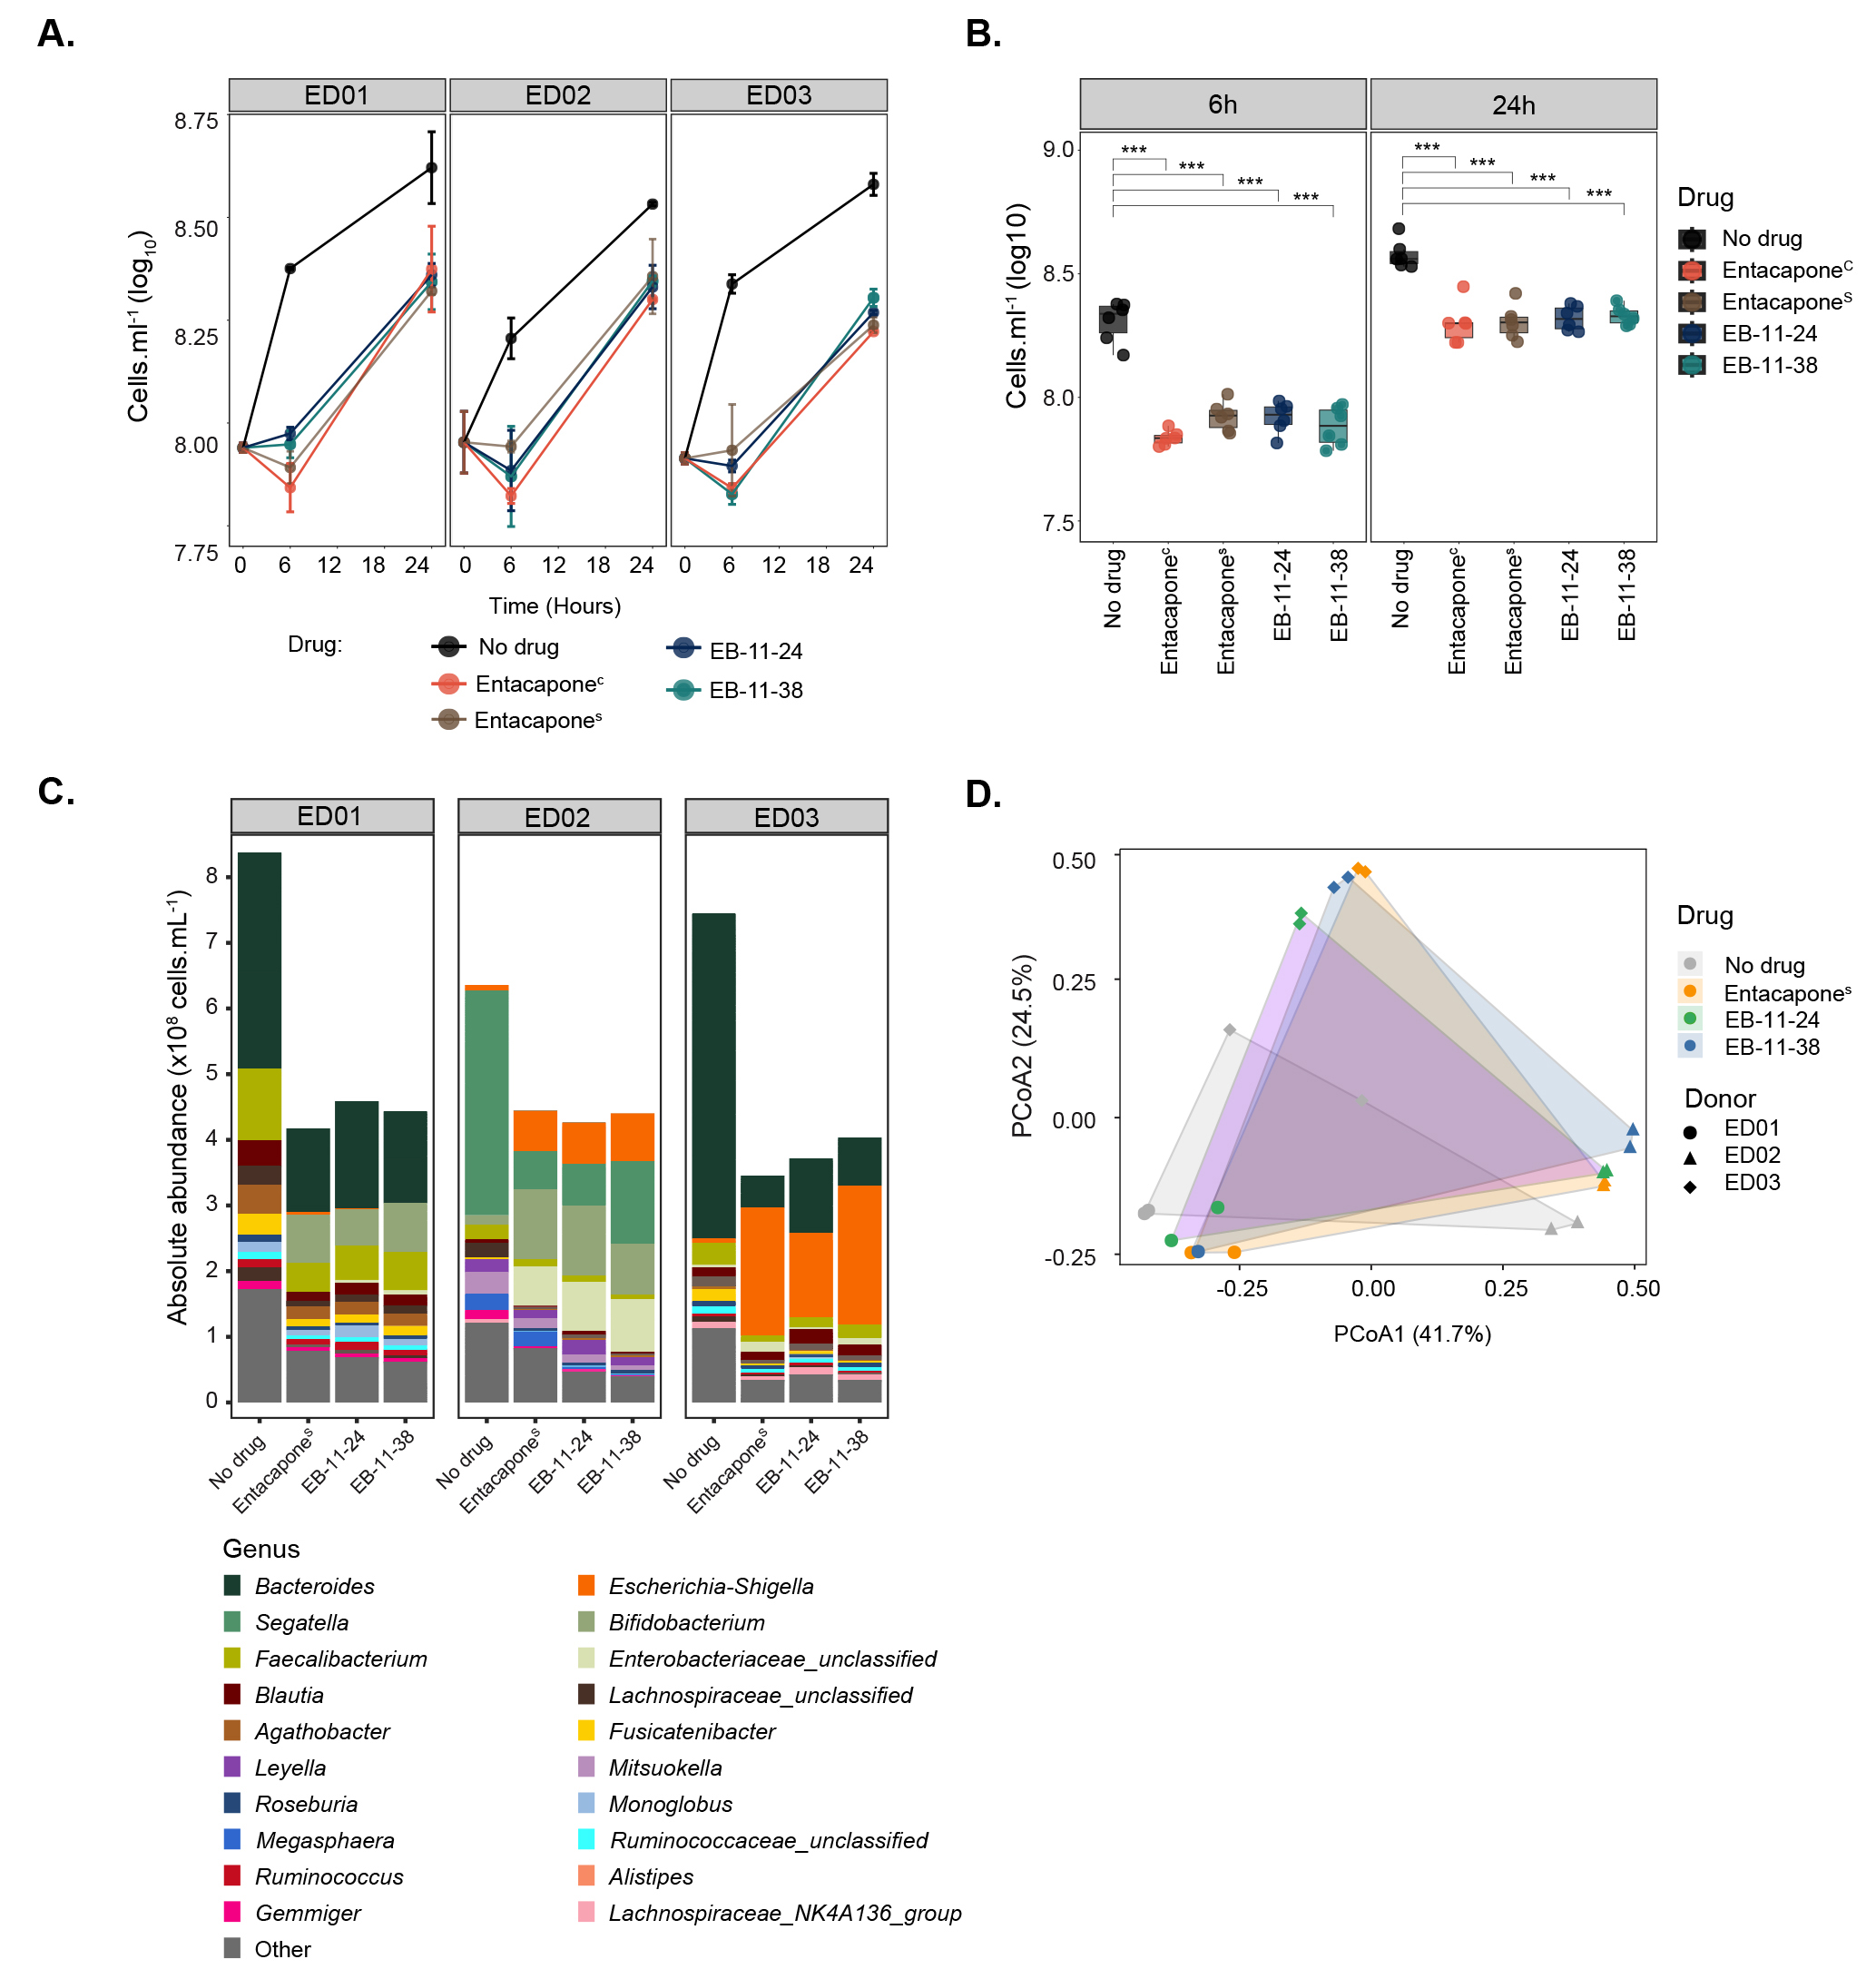
Figure 2. Entacapone alkyne-derivatives impact microbiota composition and abundance in a manner similar to the native drug. (A) Microbial cell loads in faecal incubation vials amended with entacaponeC, entacaponeS, EB-11-24 and EB-11-38, and a no-drug control (DMSO). Samples originated from three different donors (ED01, ED02, or ED03). Microbial cell loads were measured at 0, 6, and 24 h by flow cytometry; (B) Box plots illustrate the significant impact of entacapone derivatives and commercial entacapone on microbial growth, as shown in A. Error bars indicate the standard deviation from duplicate samples. Statistical significance between drug-treated samples and the DMSO no-drug control was assessed using one-way ANOVA with Tukey’s HSD test, (P < 0.001***), as presented in Supplementary Table 1; (C) Absolute abundances of genera assessed using 16S rRNA gene amplicon sequencing in no-drug controls and samples treated with entacaponeS, and EB-11-24, EB-11-38, separated per donor. For absolute abundances, genera with counts below 3.0 × 10⁶ cells. mL-1 were categorised as “Other”; (D) Principal Coordinate Analysis (PCoA) of gut microbiota community composition for drug-treated samples and controls across three donors, based on a Bray-Curtis dissimilarity matrix. HSD: Honest significant difference; ANOVA: analysis of variance.


