


fig4
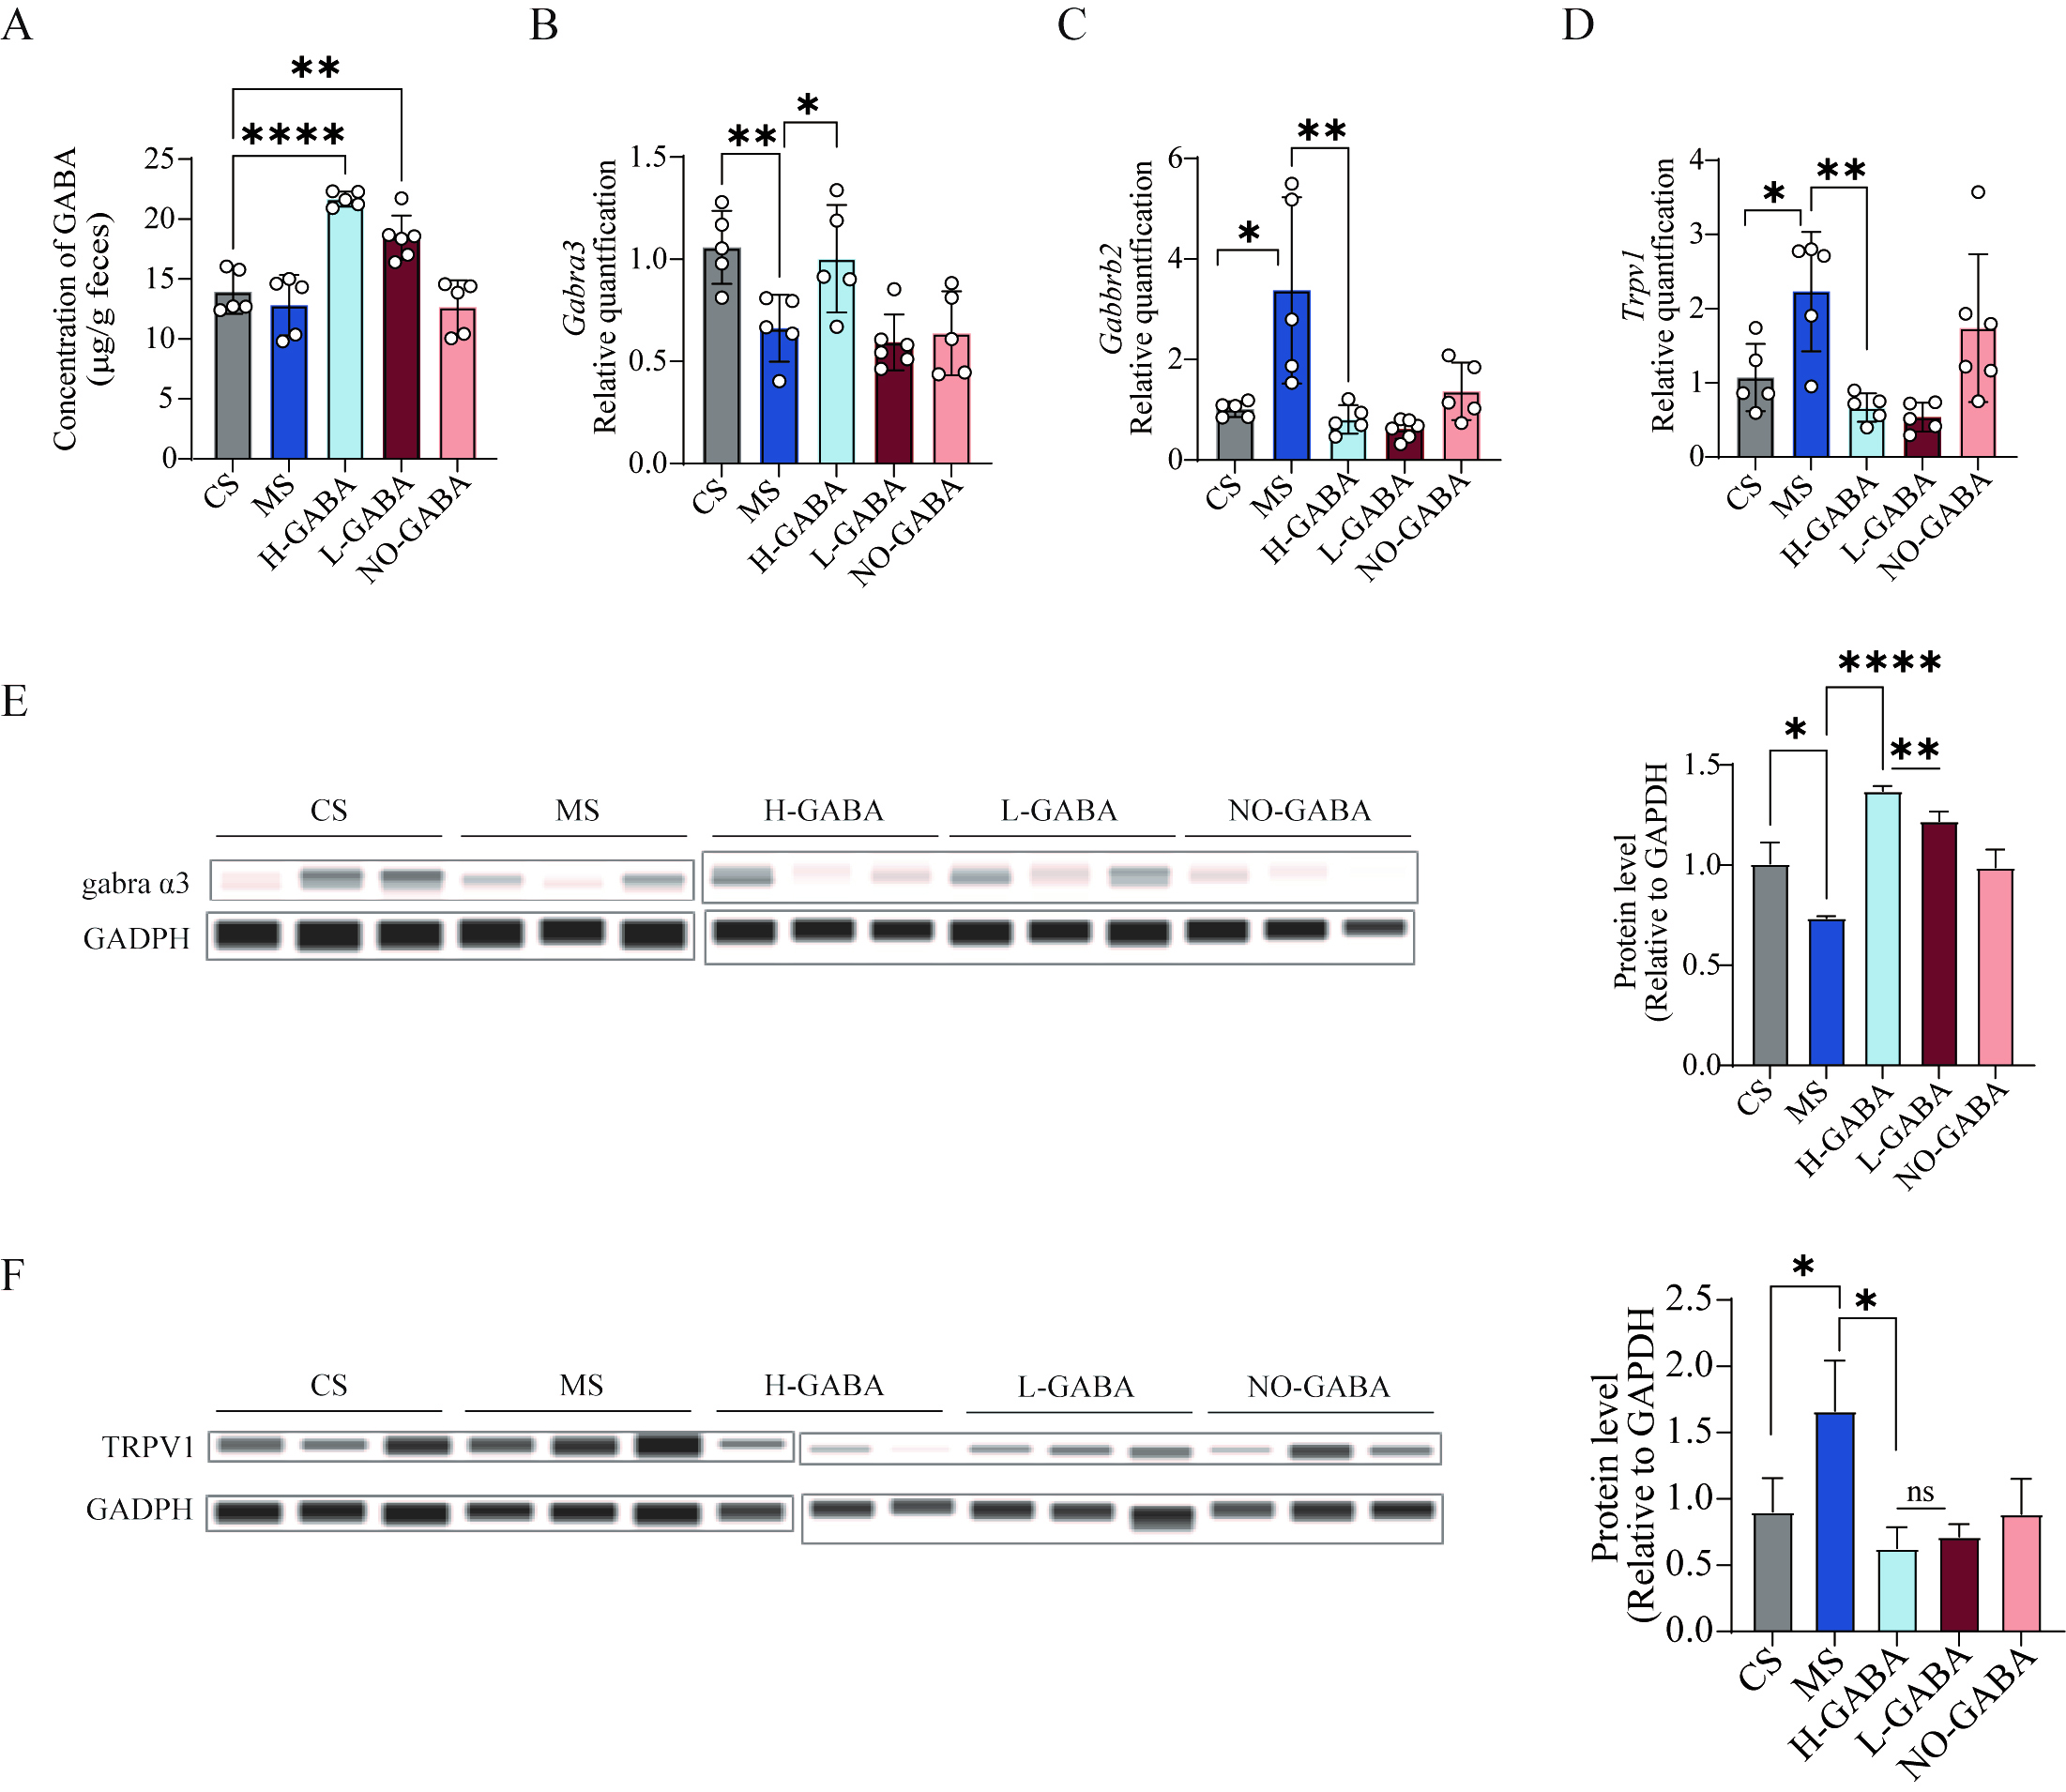
Figure 4. Regulatory effects of GABA-producing Lactococcus lactis on intestinal GABA signaling pathways. (A) GABA concentration in colonic contents; (B) mRNA expression of GABRA13; (C) mRNA expression of the GABBR2; (D) mRNA expression of TRPV1; (E) Protein expression of the GRBRA3; (F) Protein expression of TRPV1. Data were analyzed using one-way ANOVA followed by Dunnett’s multiple comparisons test against the MS group. ns stands for P > 0.05, *P < 0.05; **P < 0.01; ***P < 0.001; ****P < 0.0001. GABA: Gamma-aminobutyric acid; MS: model + stress.


