fig5
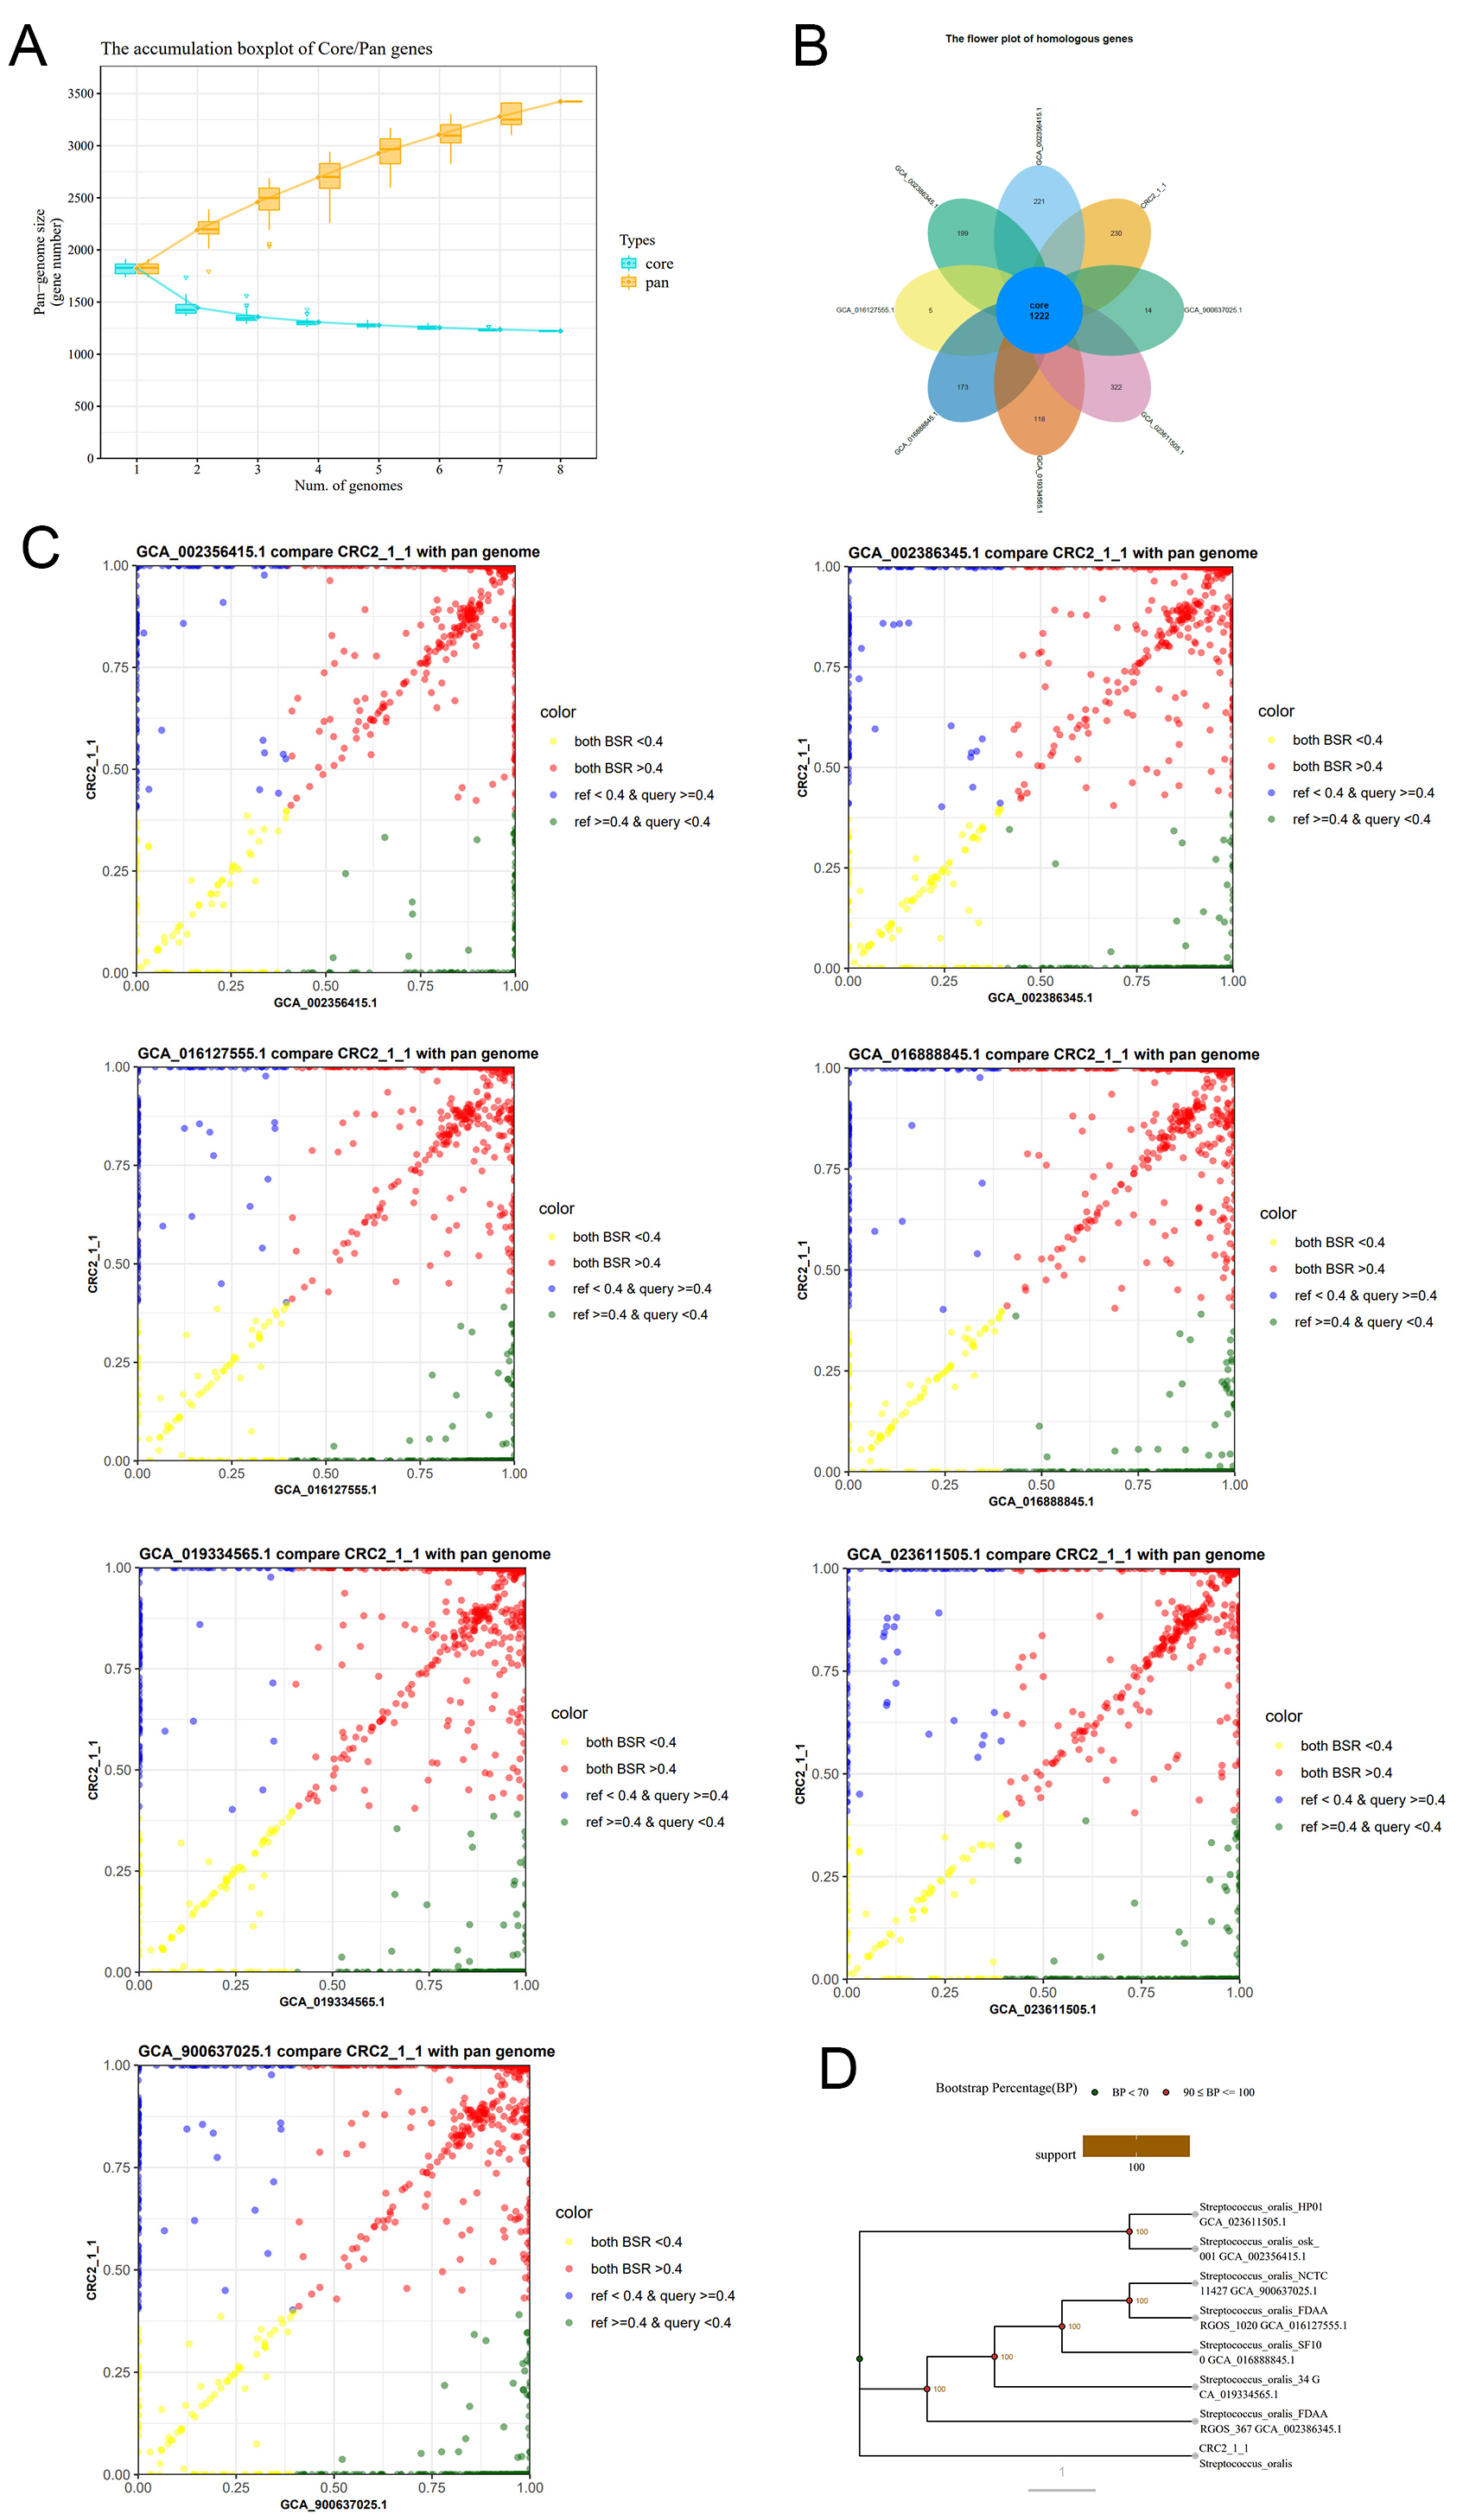
Figure 5. Pan-genome analysis of CRC211 and seven other S. oralis strains (A) Core- and pan-genome curves showing an open pan-genome (increasing with additional strains) and a decreasing core genome, indicative of high genomic plasticity; (B) Flower plot showing the distribution of gene families. The center represents the 1,222 core genes shared by all strains, while the petals represent strain-specific genes; (C) BSR scatter plots comparing CRC211 against each of the other strains. Points above the diagonal indicate higher gene similarity; (D) Phylogenetic tree based on single-copy orthologous genes, illustrating the evolutionary relationships among the eight S. oralis strains. S. oralis: Streptococcus oralis; BSR: Blast Score Ratio.


