fig3
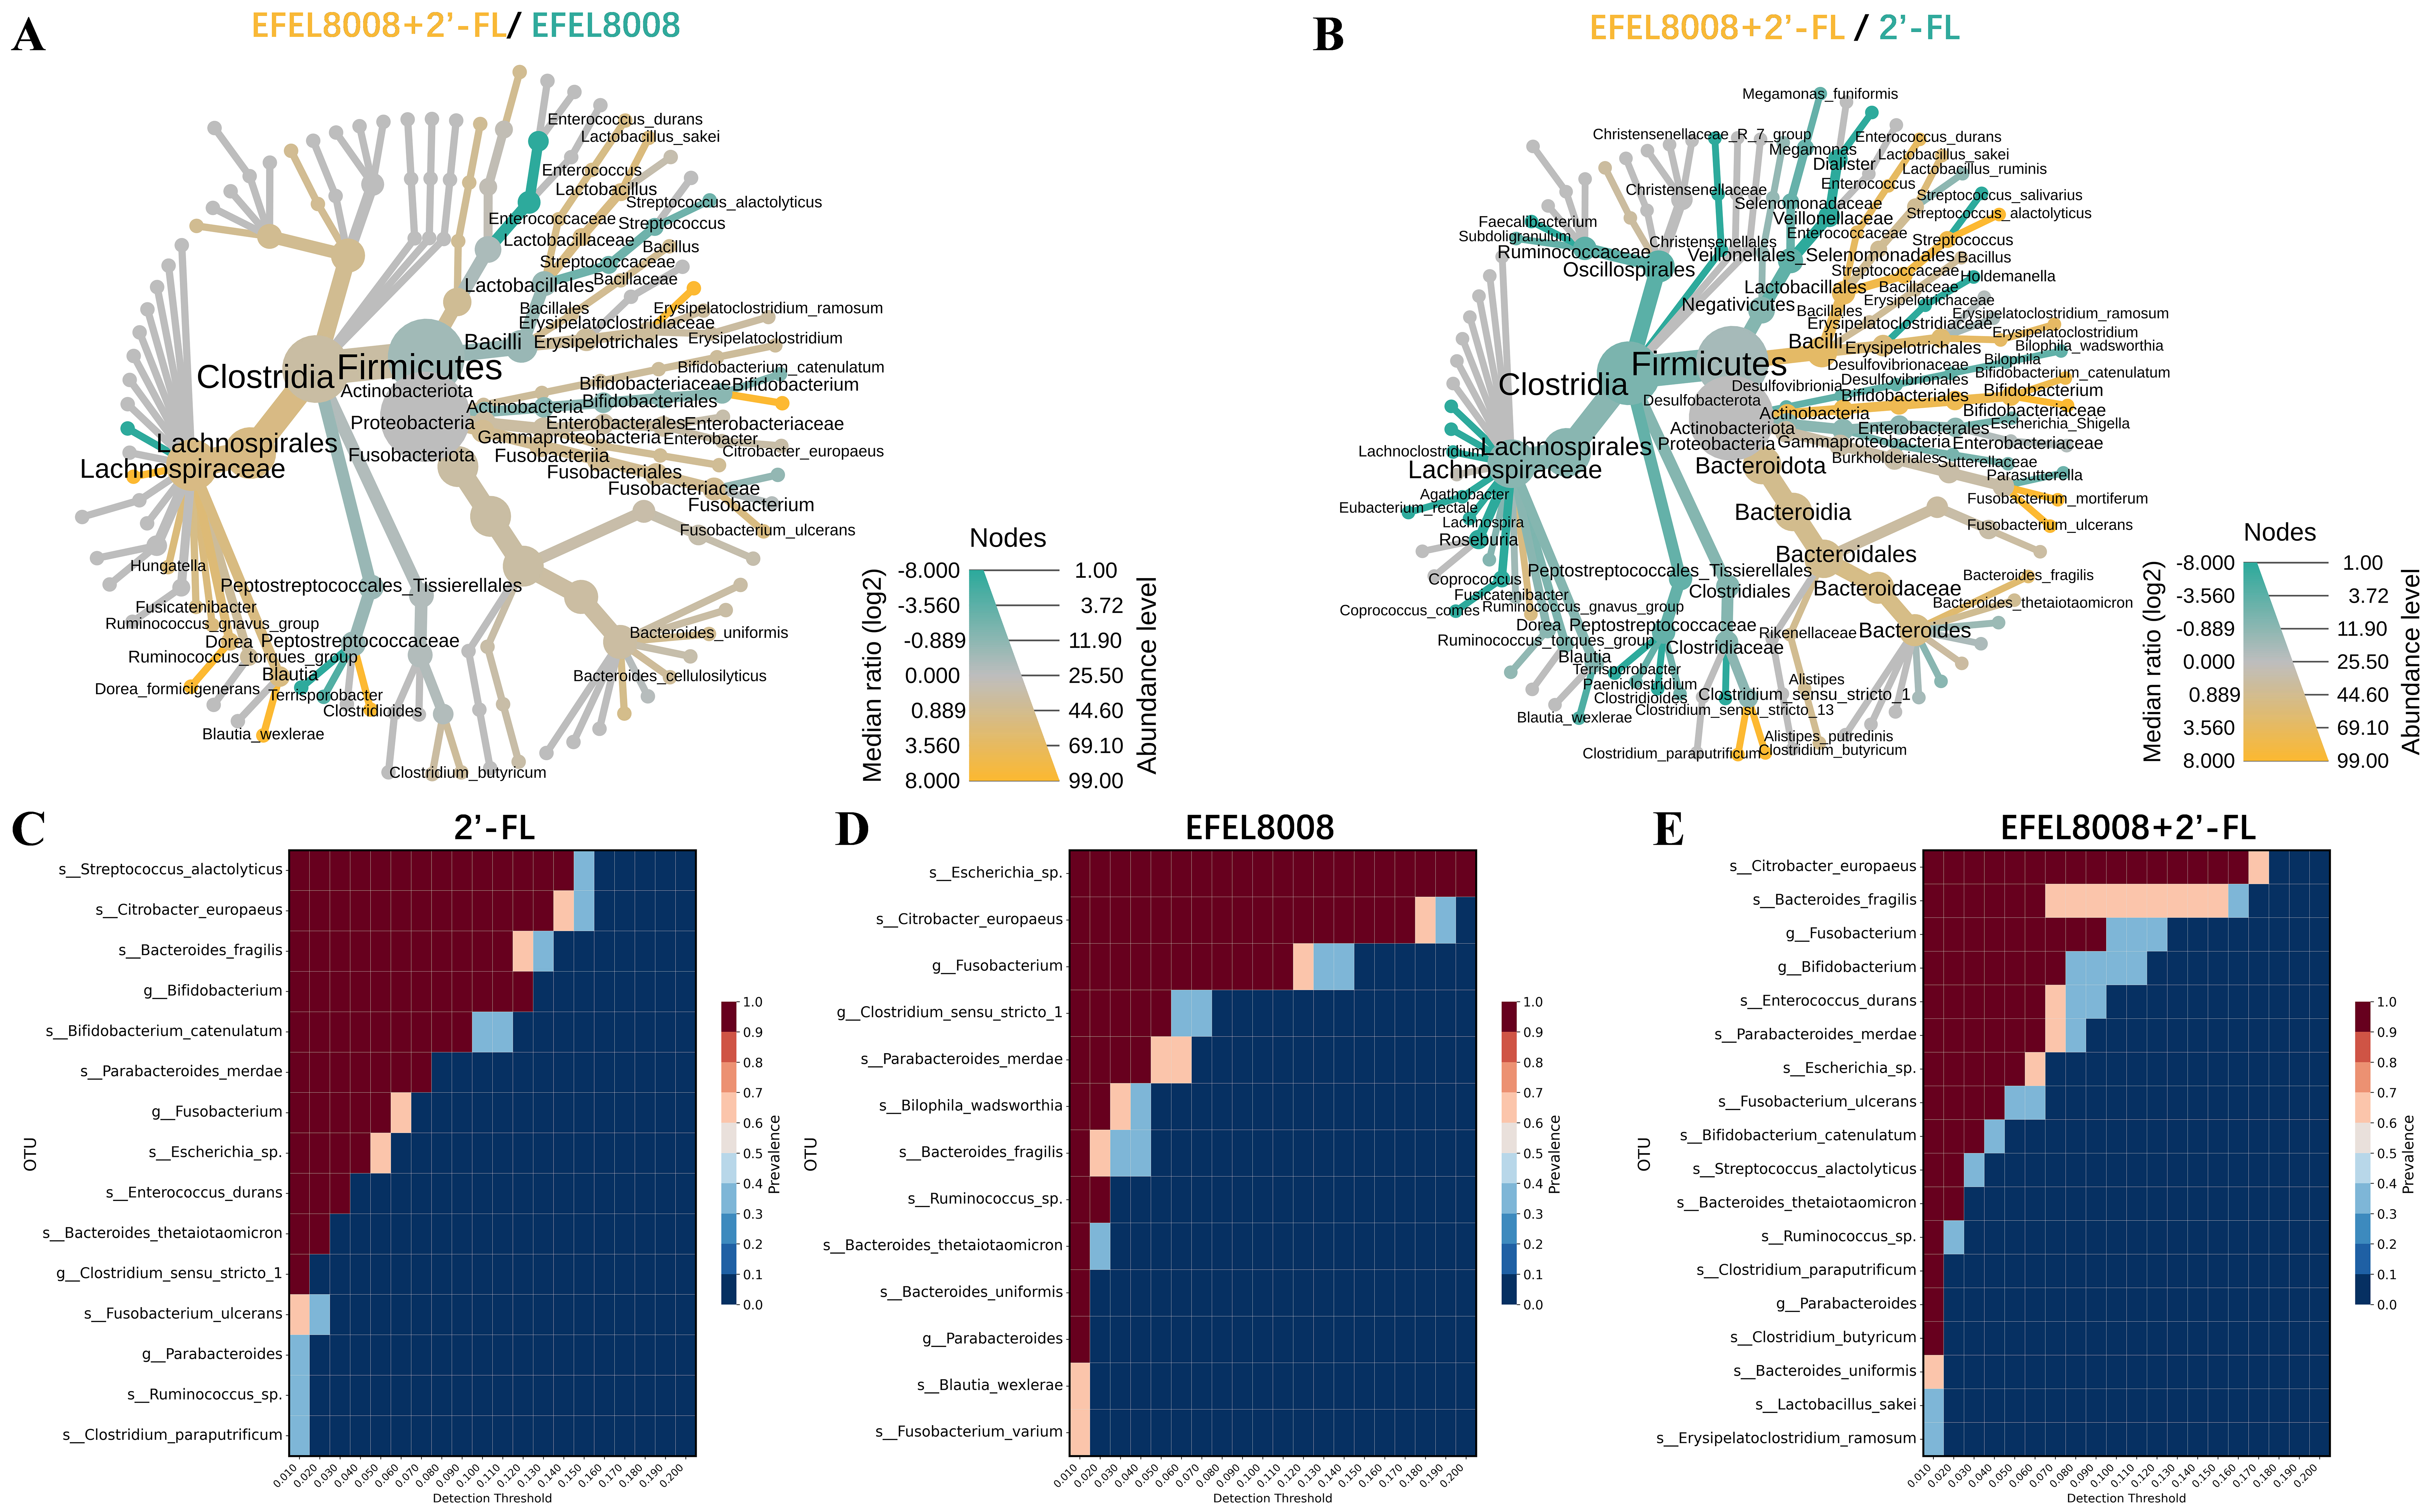
Figure 3. Comparison of microbial taxonomic compositions after in vitro fecal fermentation. Heat tree analysis compared microbial communities using median abundance and statistical differences based on the non-parametric Wilcoxon Rank Sum test. 2′-FL with B. infantis EFEL8008 was compared with either (A) B. infantis EFEL8008 or (B) 2′-FL at the species level after in vitro fermentation; (C-E) Core microbiome analysis showed species prevalence across detection thresholds for (C) 2′-FL, (D) B. infantis EFEL8008, and (E) 2′-FL with B. infantis EFEL8008 after in vitro fermentation. The color gradients indicated relative abundance and prevalence of the microbial species. 2′-FL, addition of 1% (w/v) 2′-fucosyllactose; EFEL8008, addition of B. infantis EFEL8008 at 3.51 × 10⁶ CFU/mL; EFEL8008 + 2′-FL, addition of B. infantis EFEL8008 at 3.51 × 10⁶ CFU/mL and 1% 2′-FL. 2′-FL: 2′-Fucosyllactose; B. infantis: Bifidobacterium longum subsp. infantis.


