


fig1
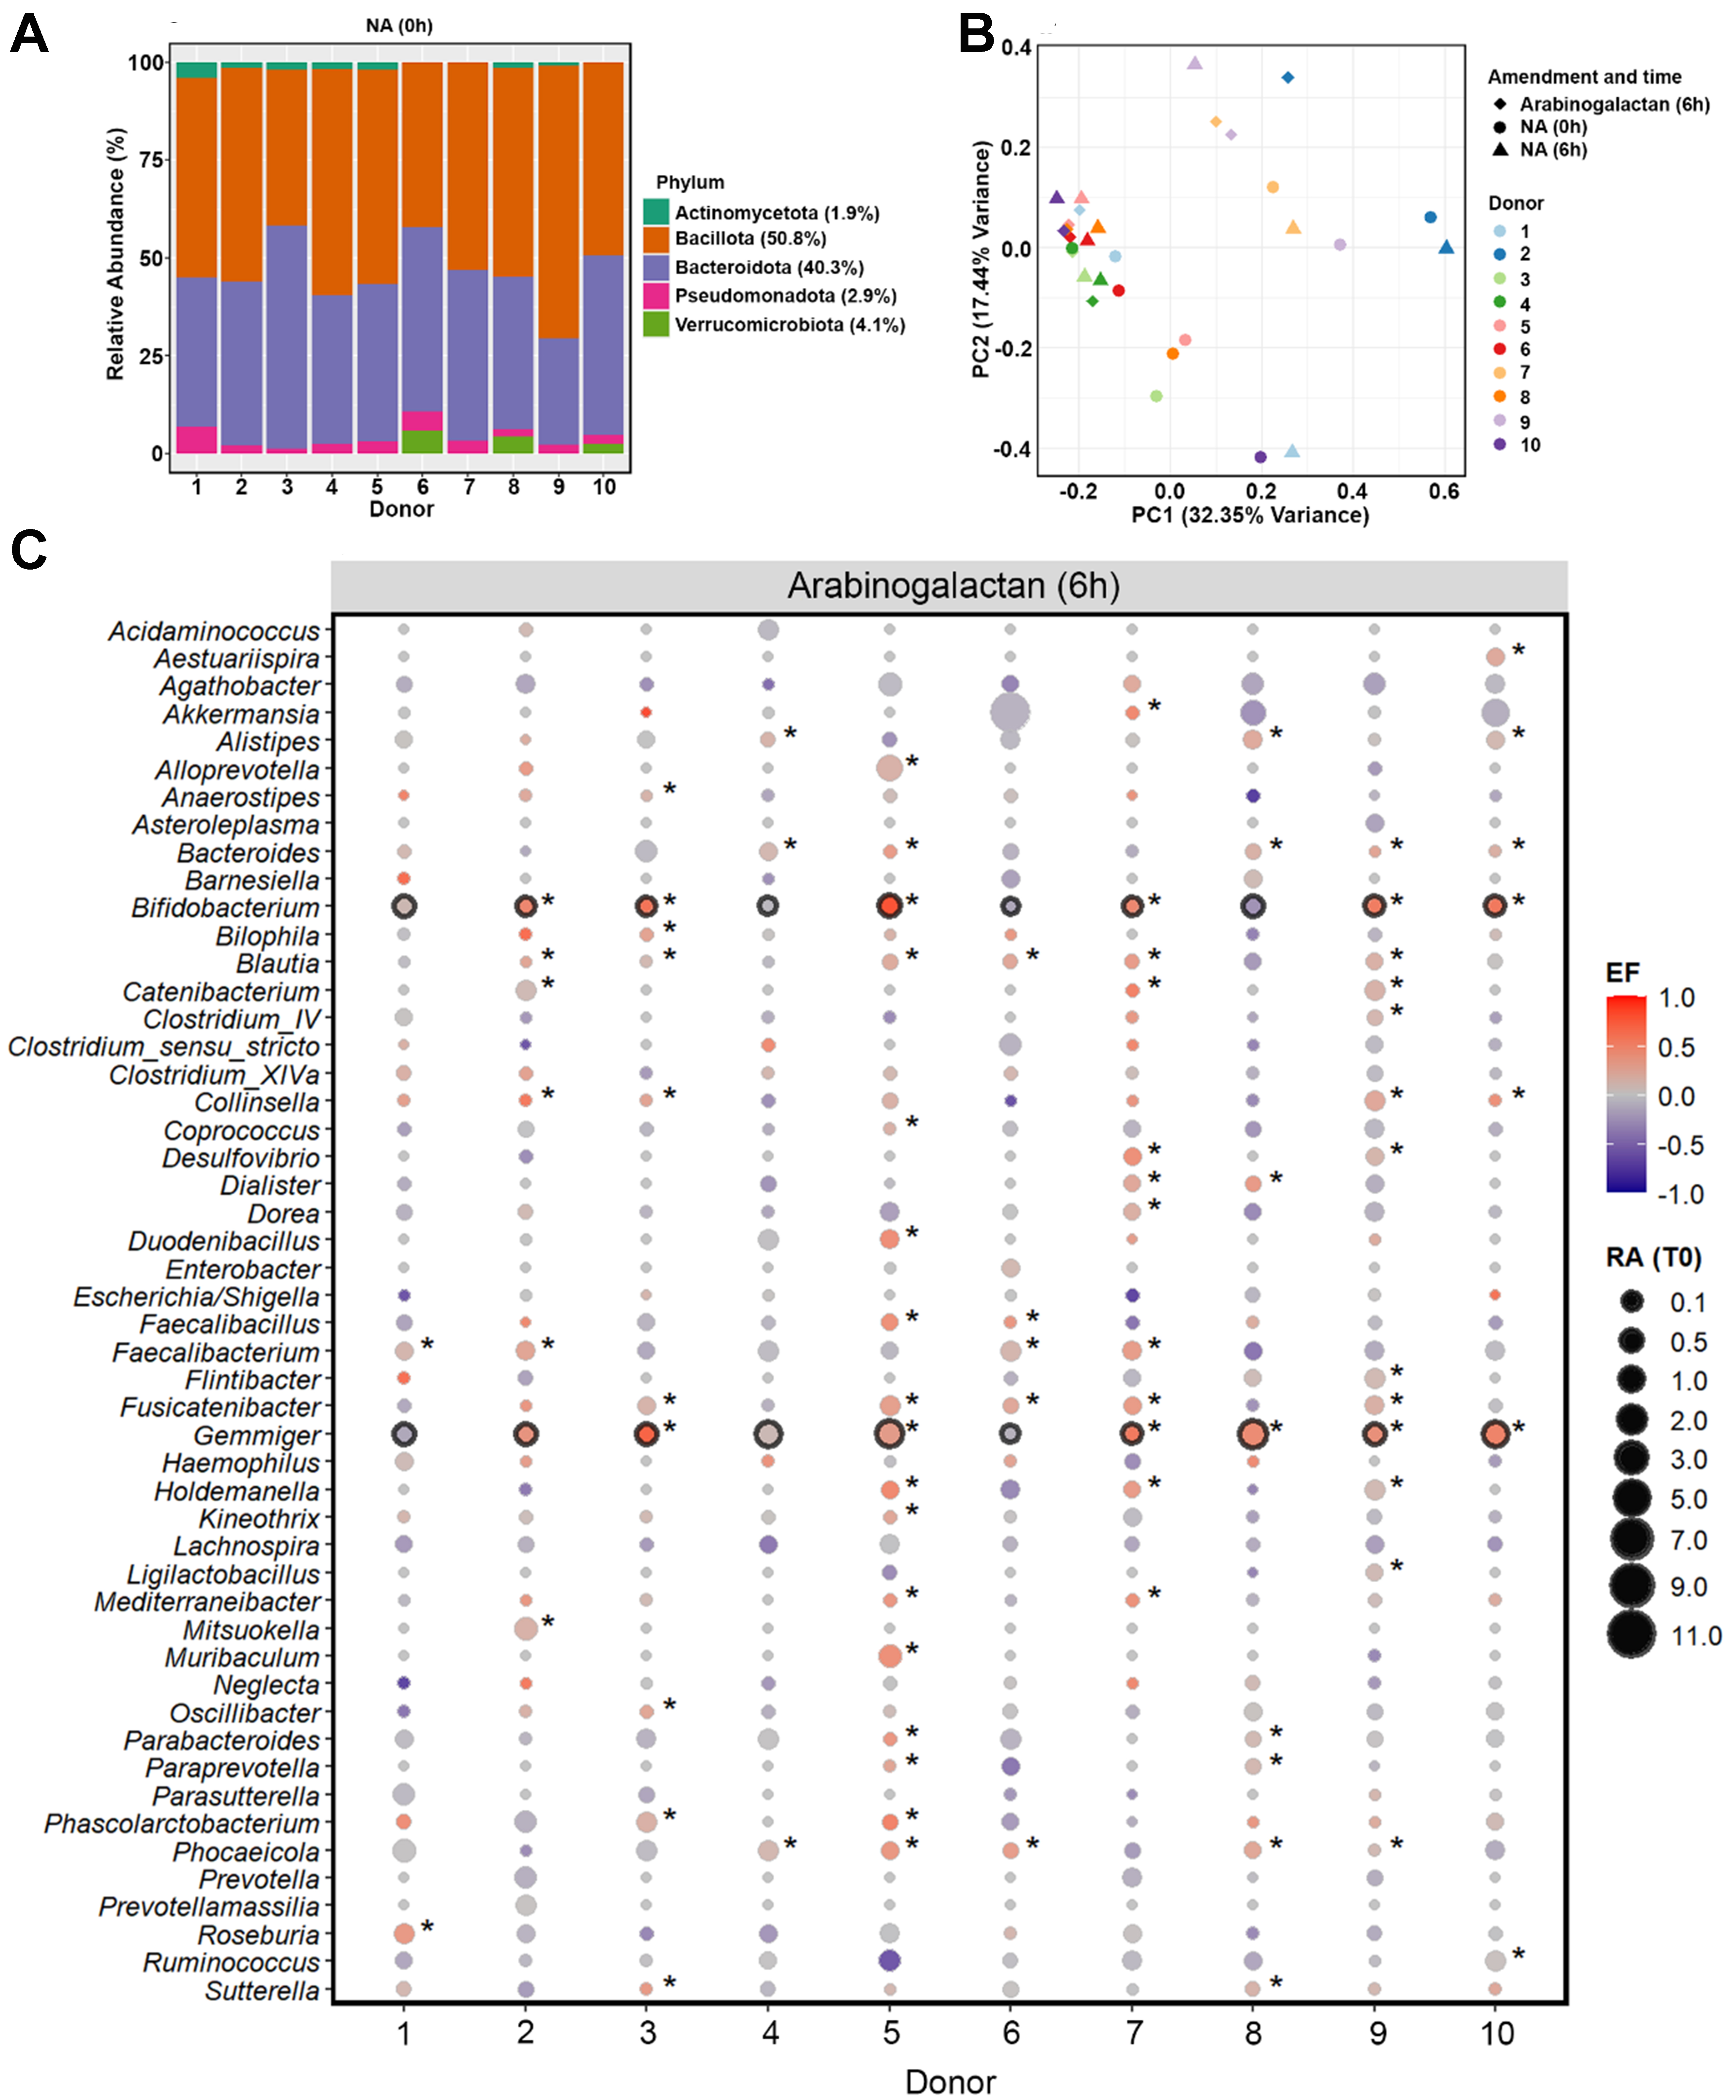
Figure 1. Baseline gut microbiota composition and response to arabinogalactan. (A) Relative abundances (%) of fecal microbiota at the phylum level across ten donors at the baseline (0 h). Average values for each phylum across all donors are provided in the legend; (B) PCoA of genus-level microbial communities, illustrating the clustering pattern of samples after 6-hour incubation with arabinogalactan, compared to NA samples at 0 and 6 h. Color and shape indicate donor identity and treatment condition, highlighting both individual and treatment-related differences; (C) Enrichment patterns of dominant bacterial genera after 6 h incubation with arabinogalactan. Bubble size indicates the relative abundance at 0 h, and color indicates the scaled EF, as described in the METHODS section. Genera with significant enrichment in individual donors are indicated by an asterisk, while those consistently enriched across all donors are highlighted with a black outline (DESeq2, Wald Test P.adj < 0.05, n = 30 samples). PCoA: Principal coordinate analysis; NA: no amendment; EF: enrichment factor.


