

fig4
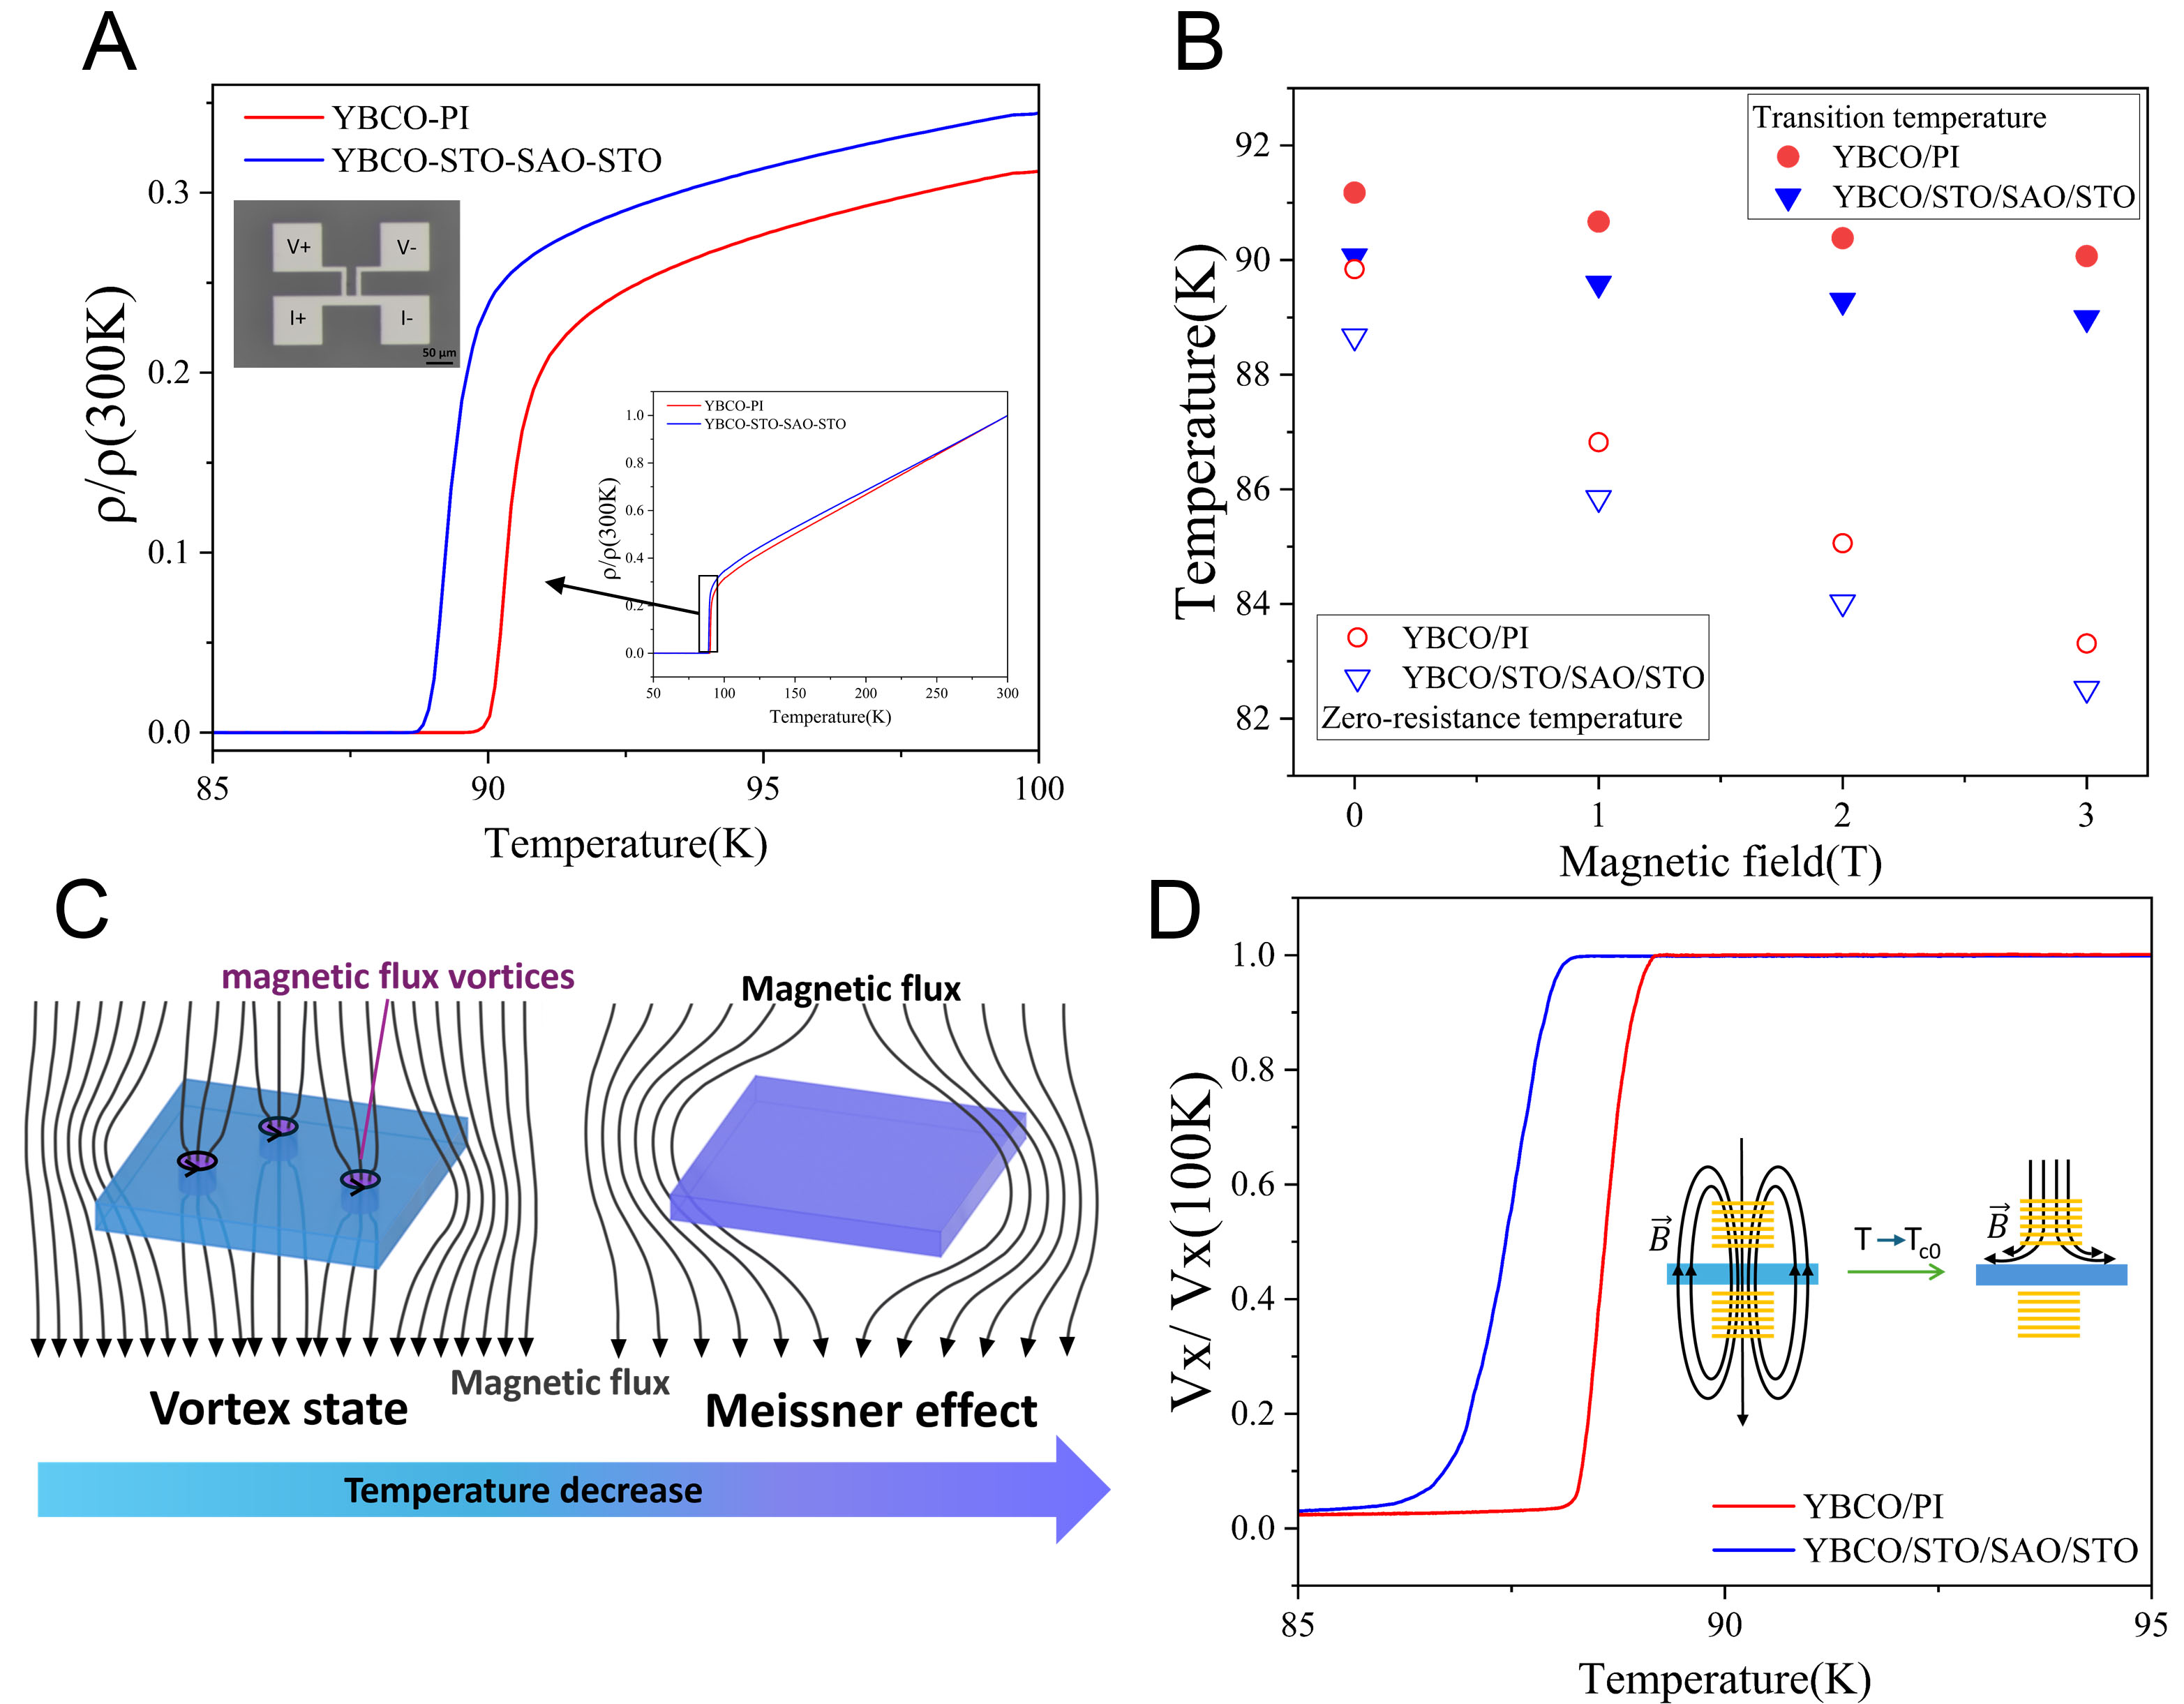
Figure 4. Comparison of electrical tests before and after YBCO peeling. (A) Resistivity-temperature (85K-100K) test curves of YBCO thin films before (blue) and after (red) peeling, with an inset on the right showing the complete image of the 50K-300K test. The image on the left shows the photolithographic structure for four-probe resistance testing; (B) Transition temperature and zero-resistance temperature before and after peeling under different magnetic fields; (C) Schematic diagram of magnetic response across the superconducting transition; (D) Comparison of induced voltage Vx(T) before and after peeling, with an inset showing a schematic diagram of the coil measurement of superconducting samples. YBCO: YBa2Cu3O7; PI: polyimide; STO: SrTiO3; SAO: Sr4Al2O7. Vx: real component.





