

fig7
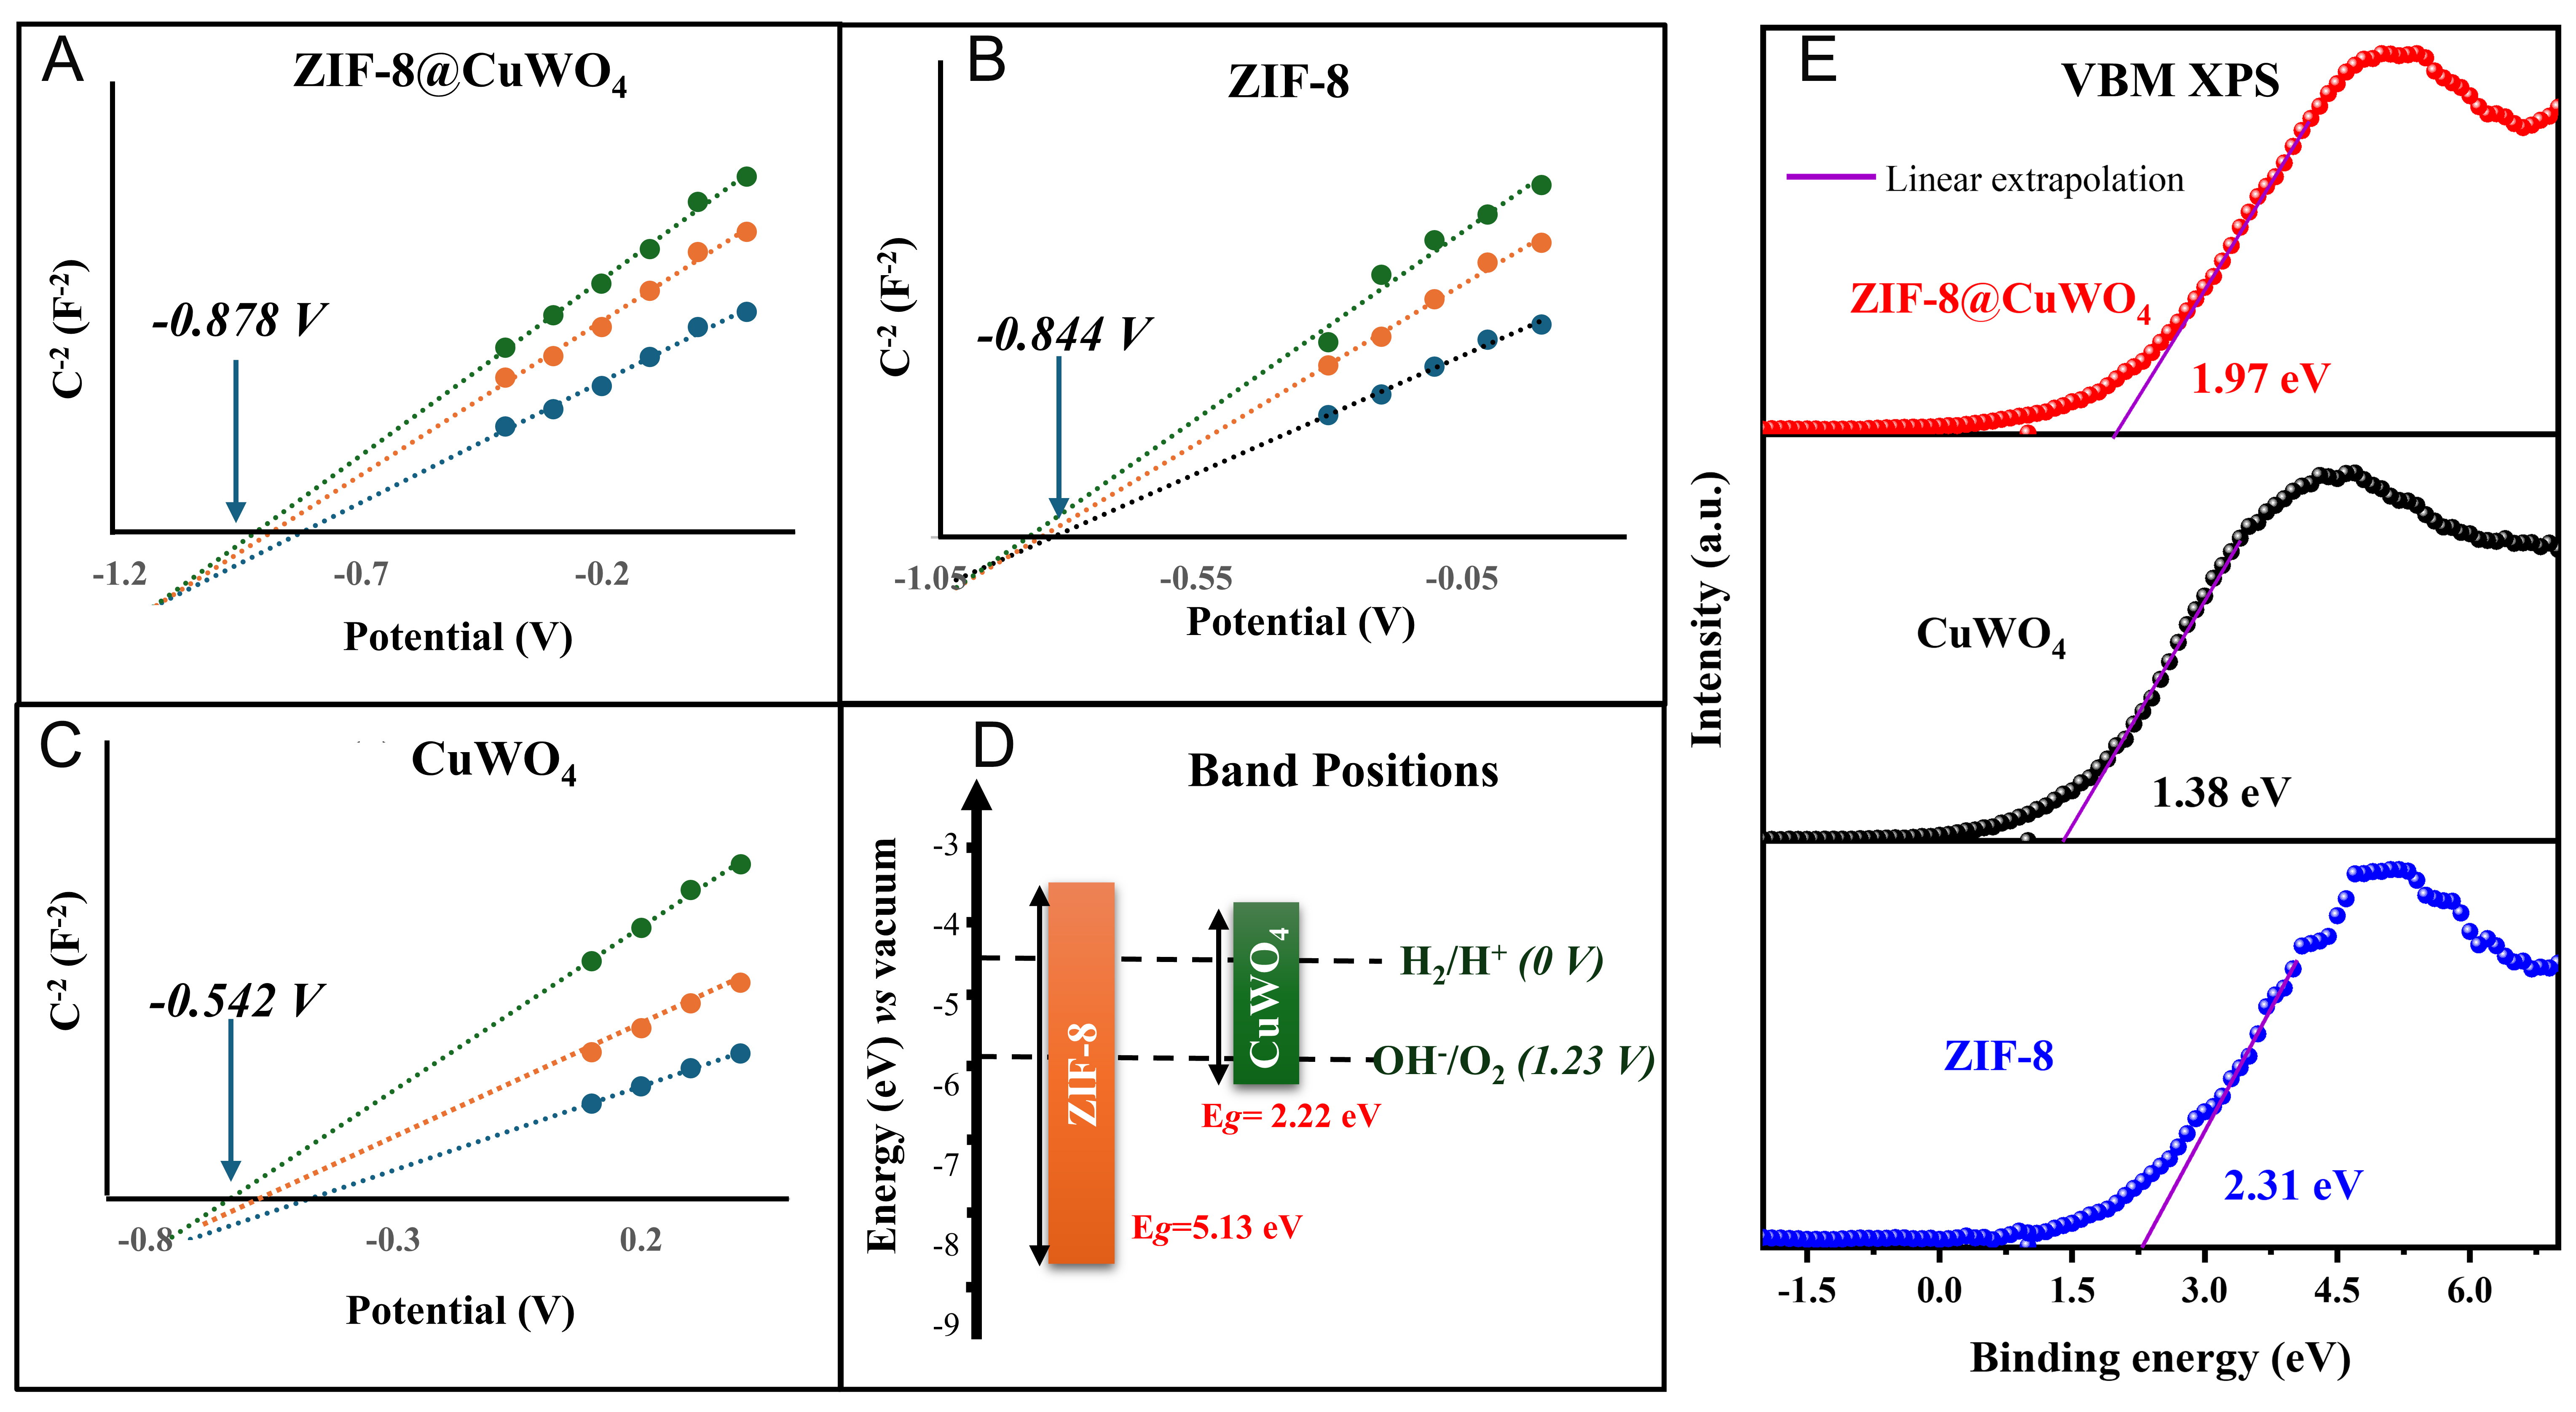
Figure 7. Mott Schottky characteristics at 1,000 Hz (blue fitted lines & dots), 1,500 Hz (orange fitted lines & dots), and 2,000 Hz (green fitted lines & dots), for ZIF-8@CuWO4 (A), ZIF-8 (B), and CuWO4 (C), plotted in Na2SO3 along with respective estimated band positions (D). The valence-band XPS spectra for ZIF-8@CuWO4, compared with the pristine CuWO4, and ZIF-8 (E).





