

fig8
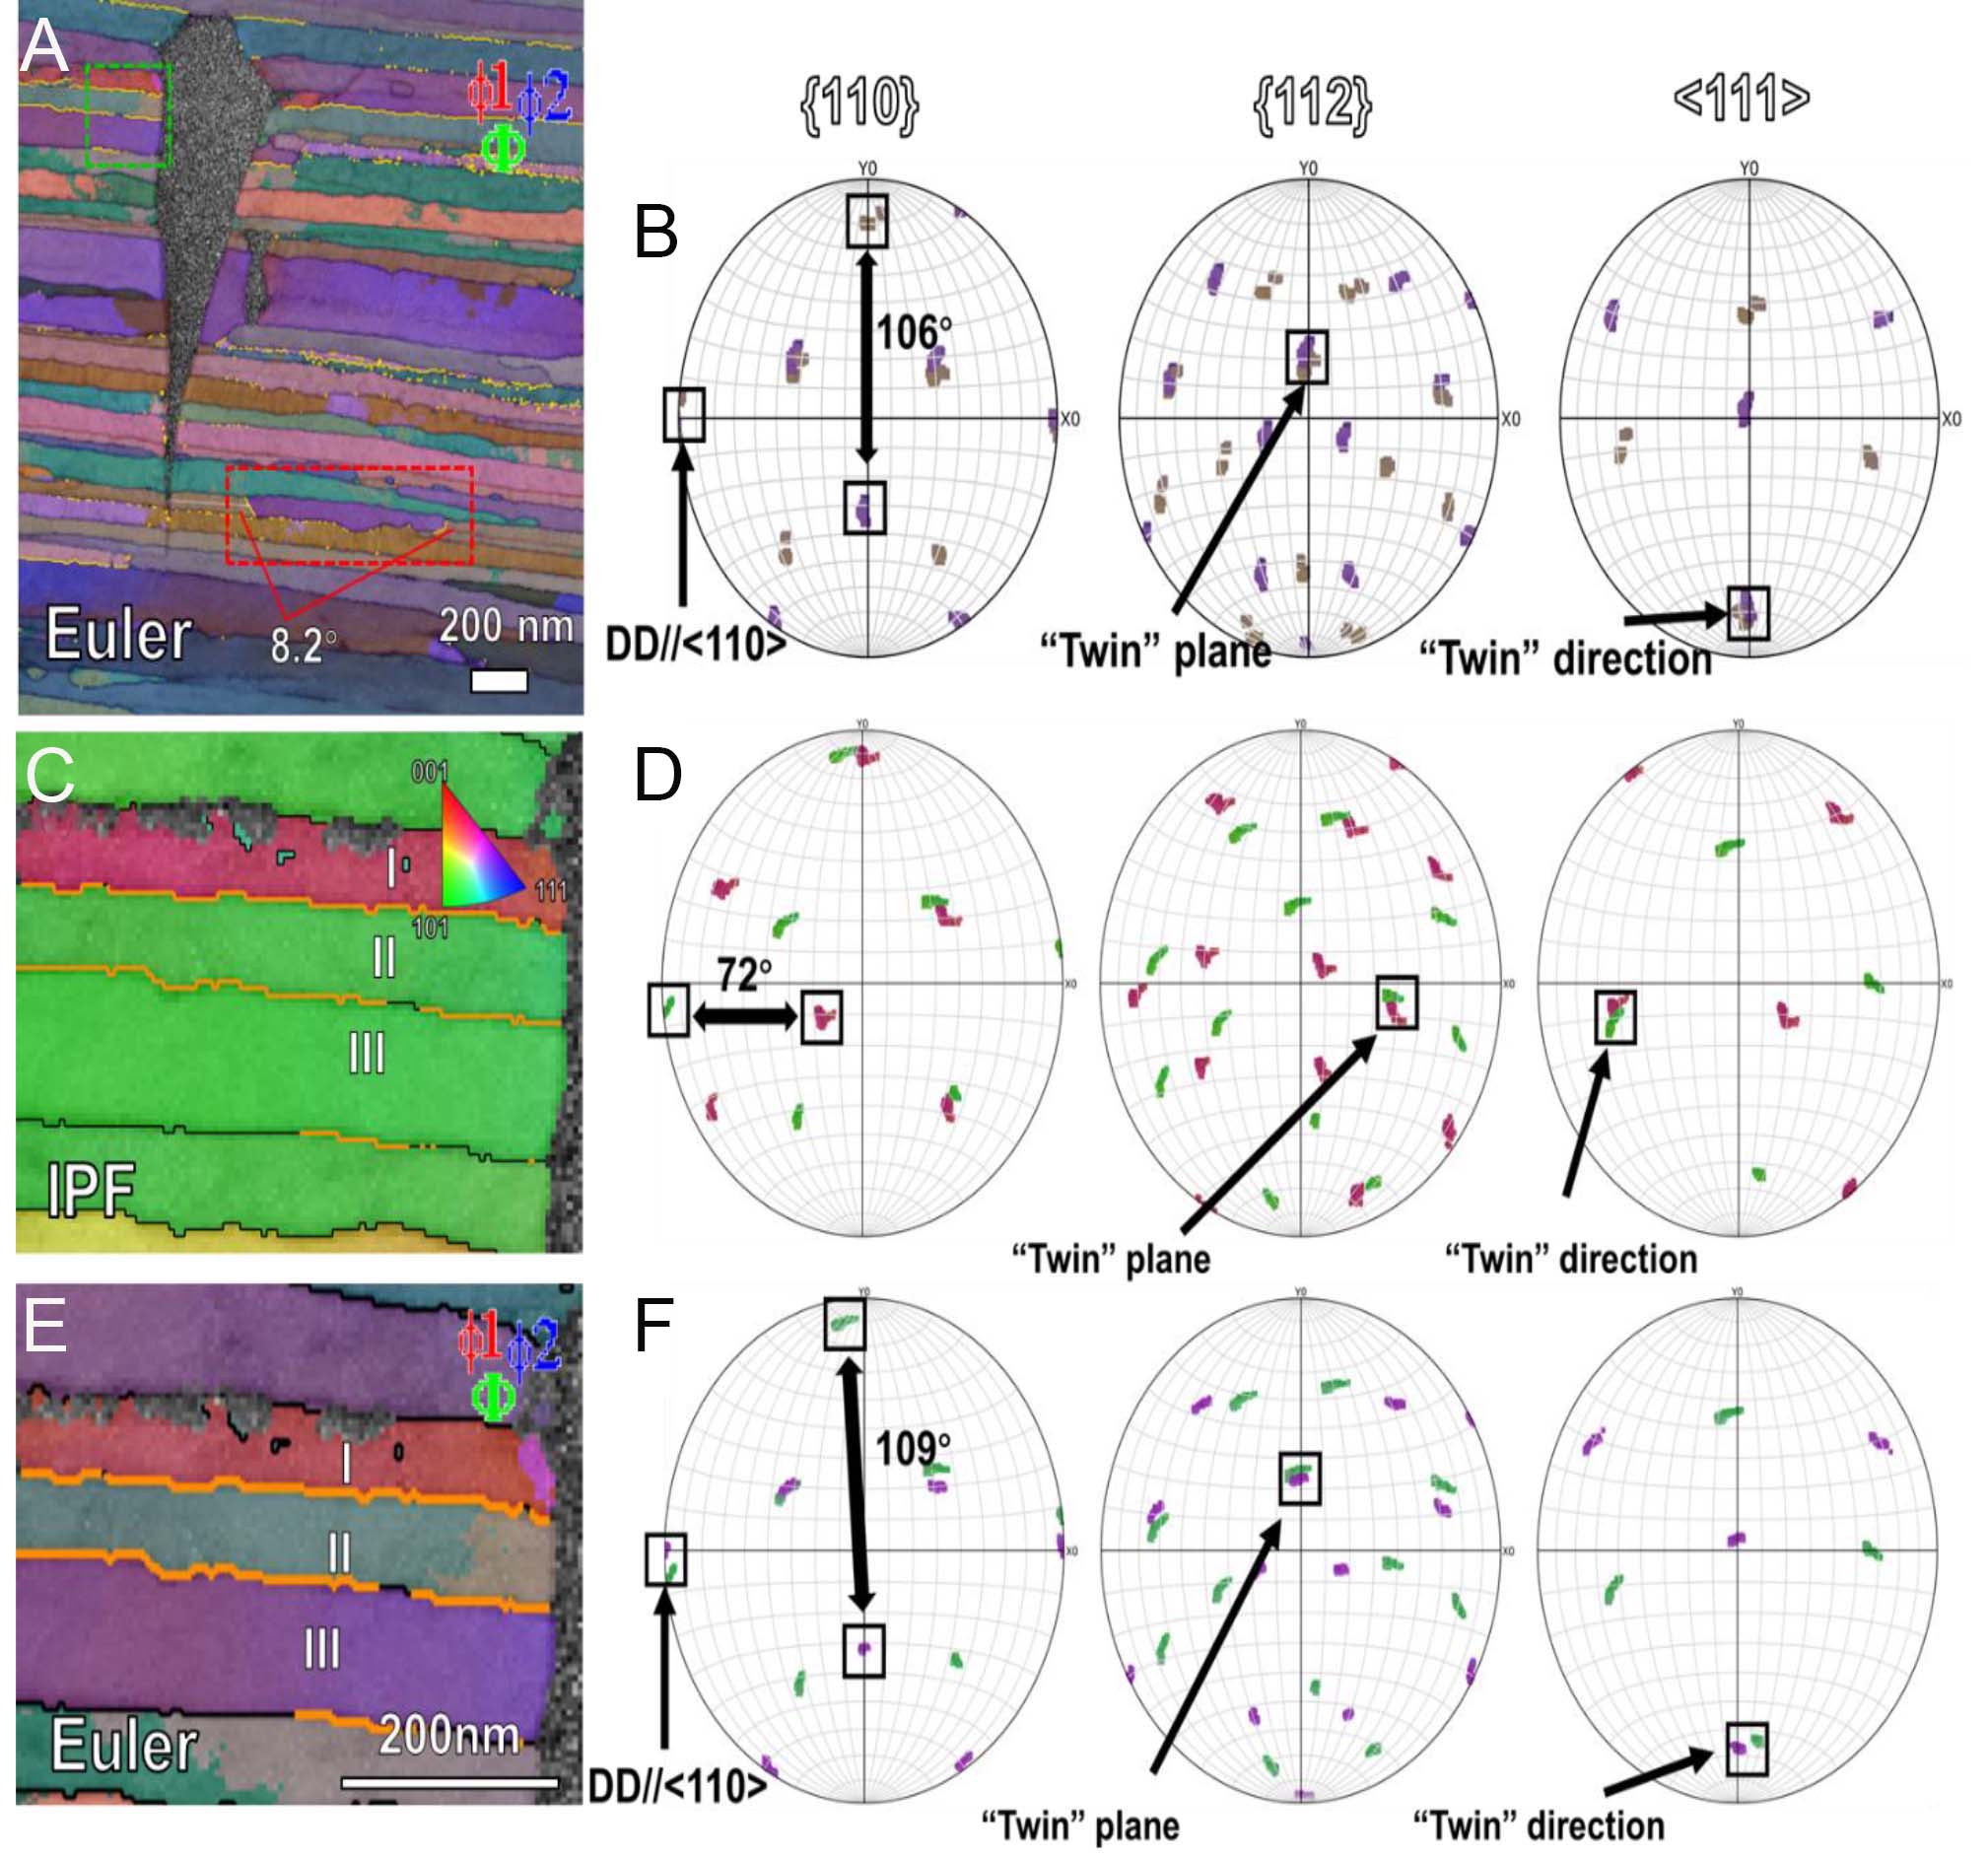
Figure 8. TKD maps and orientation analysis of tungsten wire at ε = 4.87 along longitudinal section: (A) TKD Euler-coloring map. The insert is the crystallographic analysis for the grains in red box; (B) Crystallographic orientaionship analysis for the red box in (A) using pole Figure. (C) IPF-coloring maps for the green box in (A and D) crystallographic orientaionship analysis of Fiber I and Fiber II. (E) Euler-coloring maps for the green box in (A) and (F) crystallographic orientaionship analysis of Fiber II and Fiber III.





