

fig6
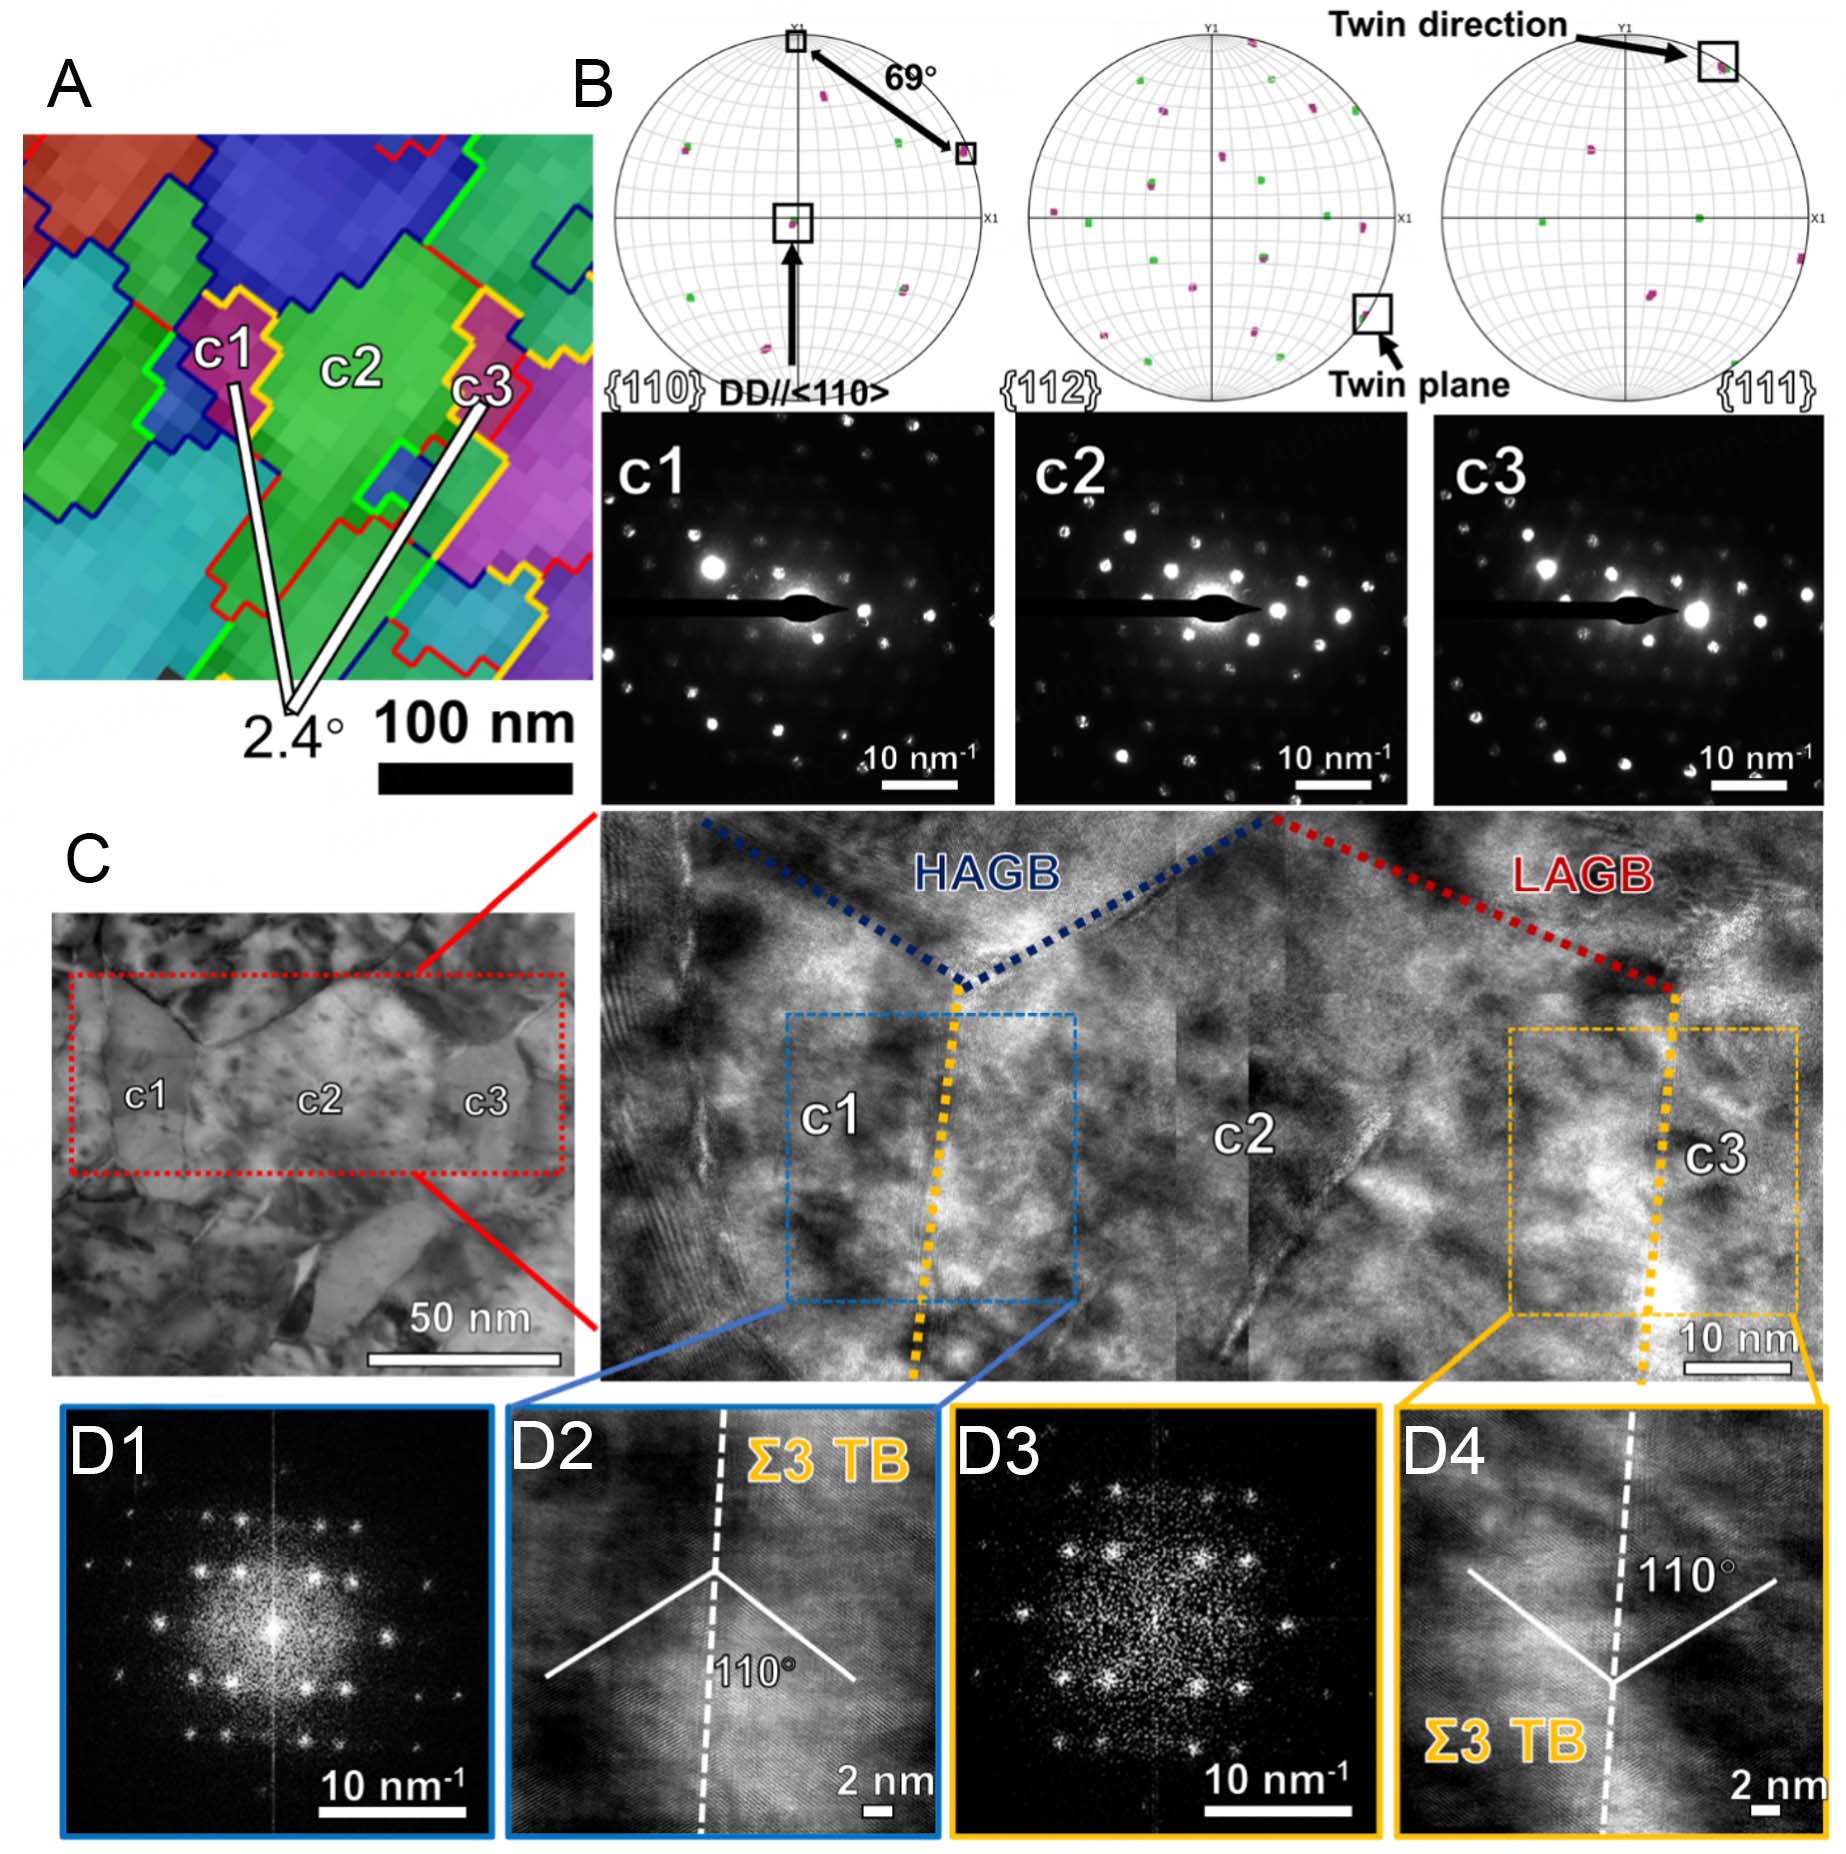
Figure 6. TKD maps and TEM micrographs of tungsten wire at ε = 4.87 taken from the cross section (A) TKD IPF coloring map. Orange line: Σ3 boundary, Blue line: HAGB, Red line: LAGB; (B) IPF pole figures. (C) Corresponding bright field STEM micrograph and corresponding HRTEM micrograph, (C1-C3) the NBD patterns of the (C1) to (C3) in (C), the zone axis is near to [110]W. (D1-D4) atomic scale structure and corresponding FFT analyisis of the two Σ3 twin boundaries.





