

fig5
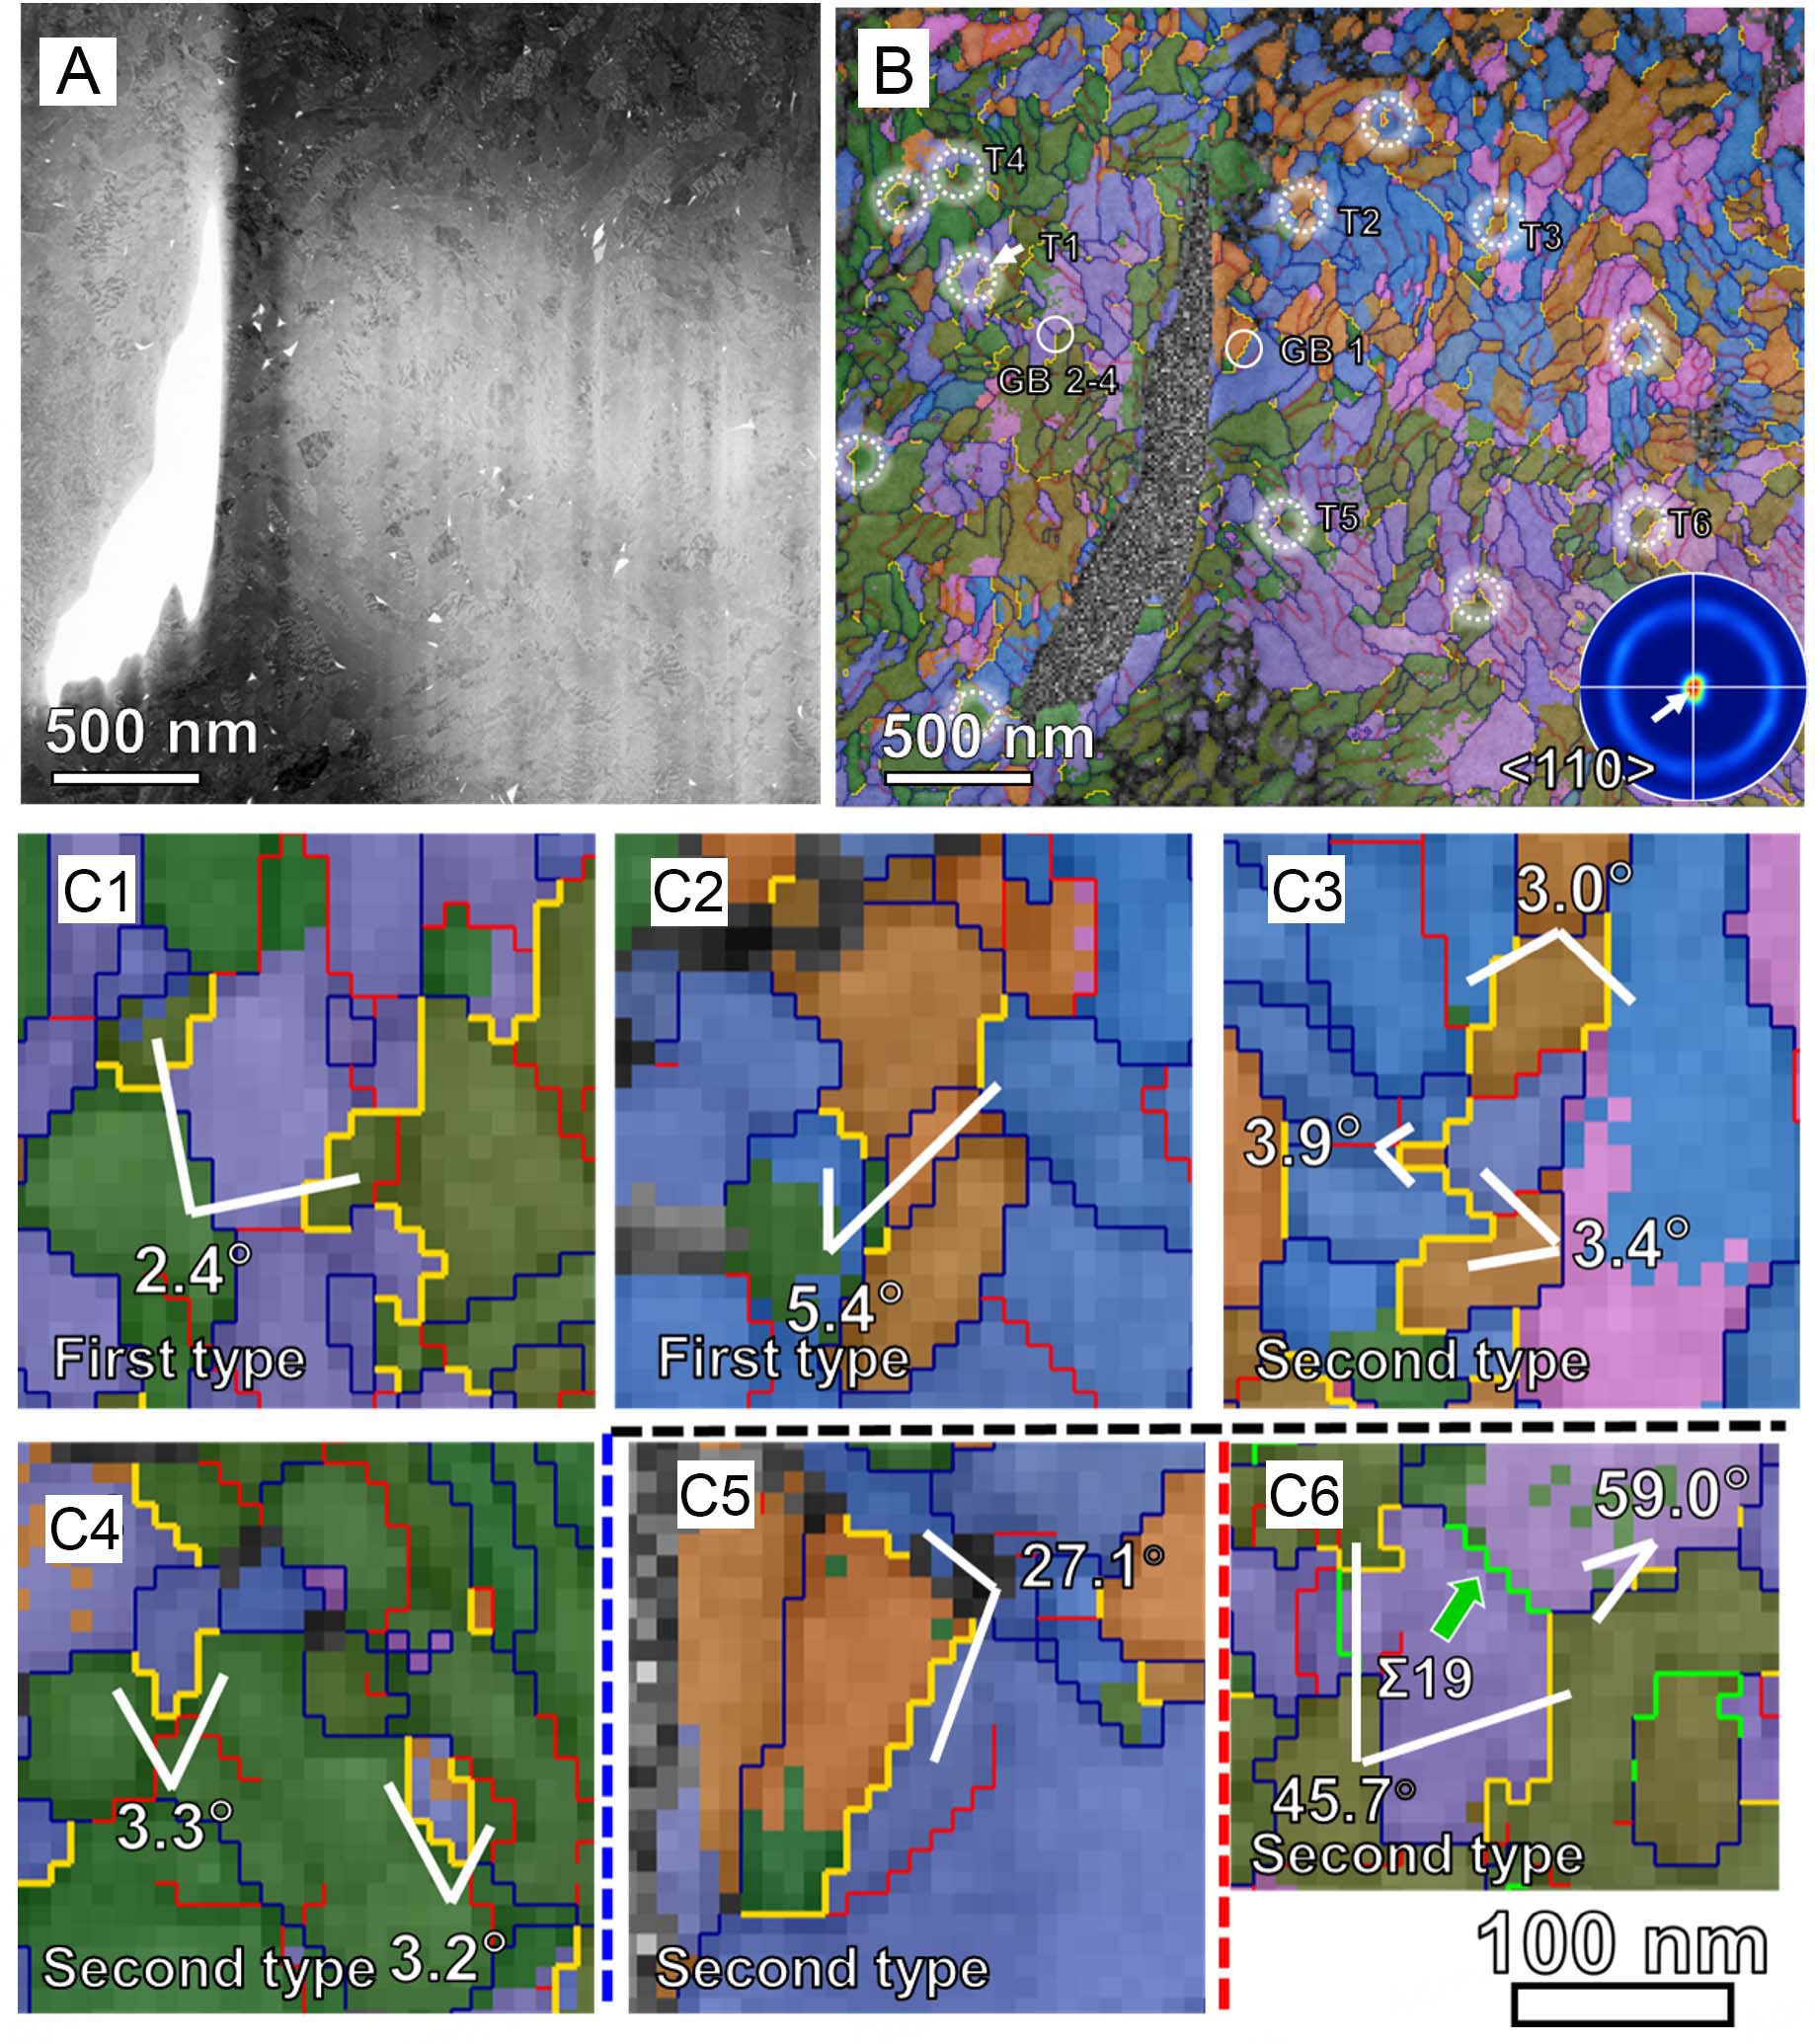
Figure 5. TEM micrographs and corresponding TKD maps of tungsten wire at ε = 4.87 taken from the cross section (i.e., looking along the drawing direction): (A) TEM micrograph; (B) Corresponding TKD map (Euler coloring map); (C1-C6) Typical features of Σ3 boundaries in the wire. The navy line, red line, orange line and green line are HAGBs, LAGBs, Σ3 boundaries and Σ19 boundaries, respectively.





