

fig4
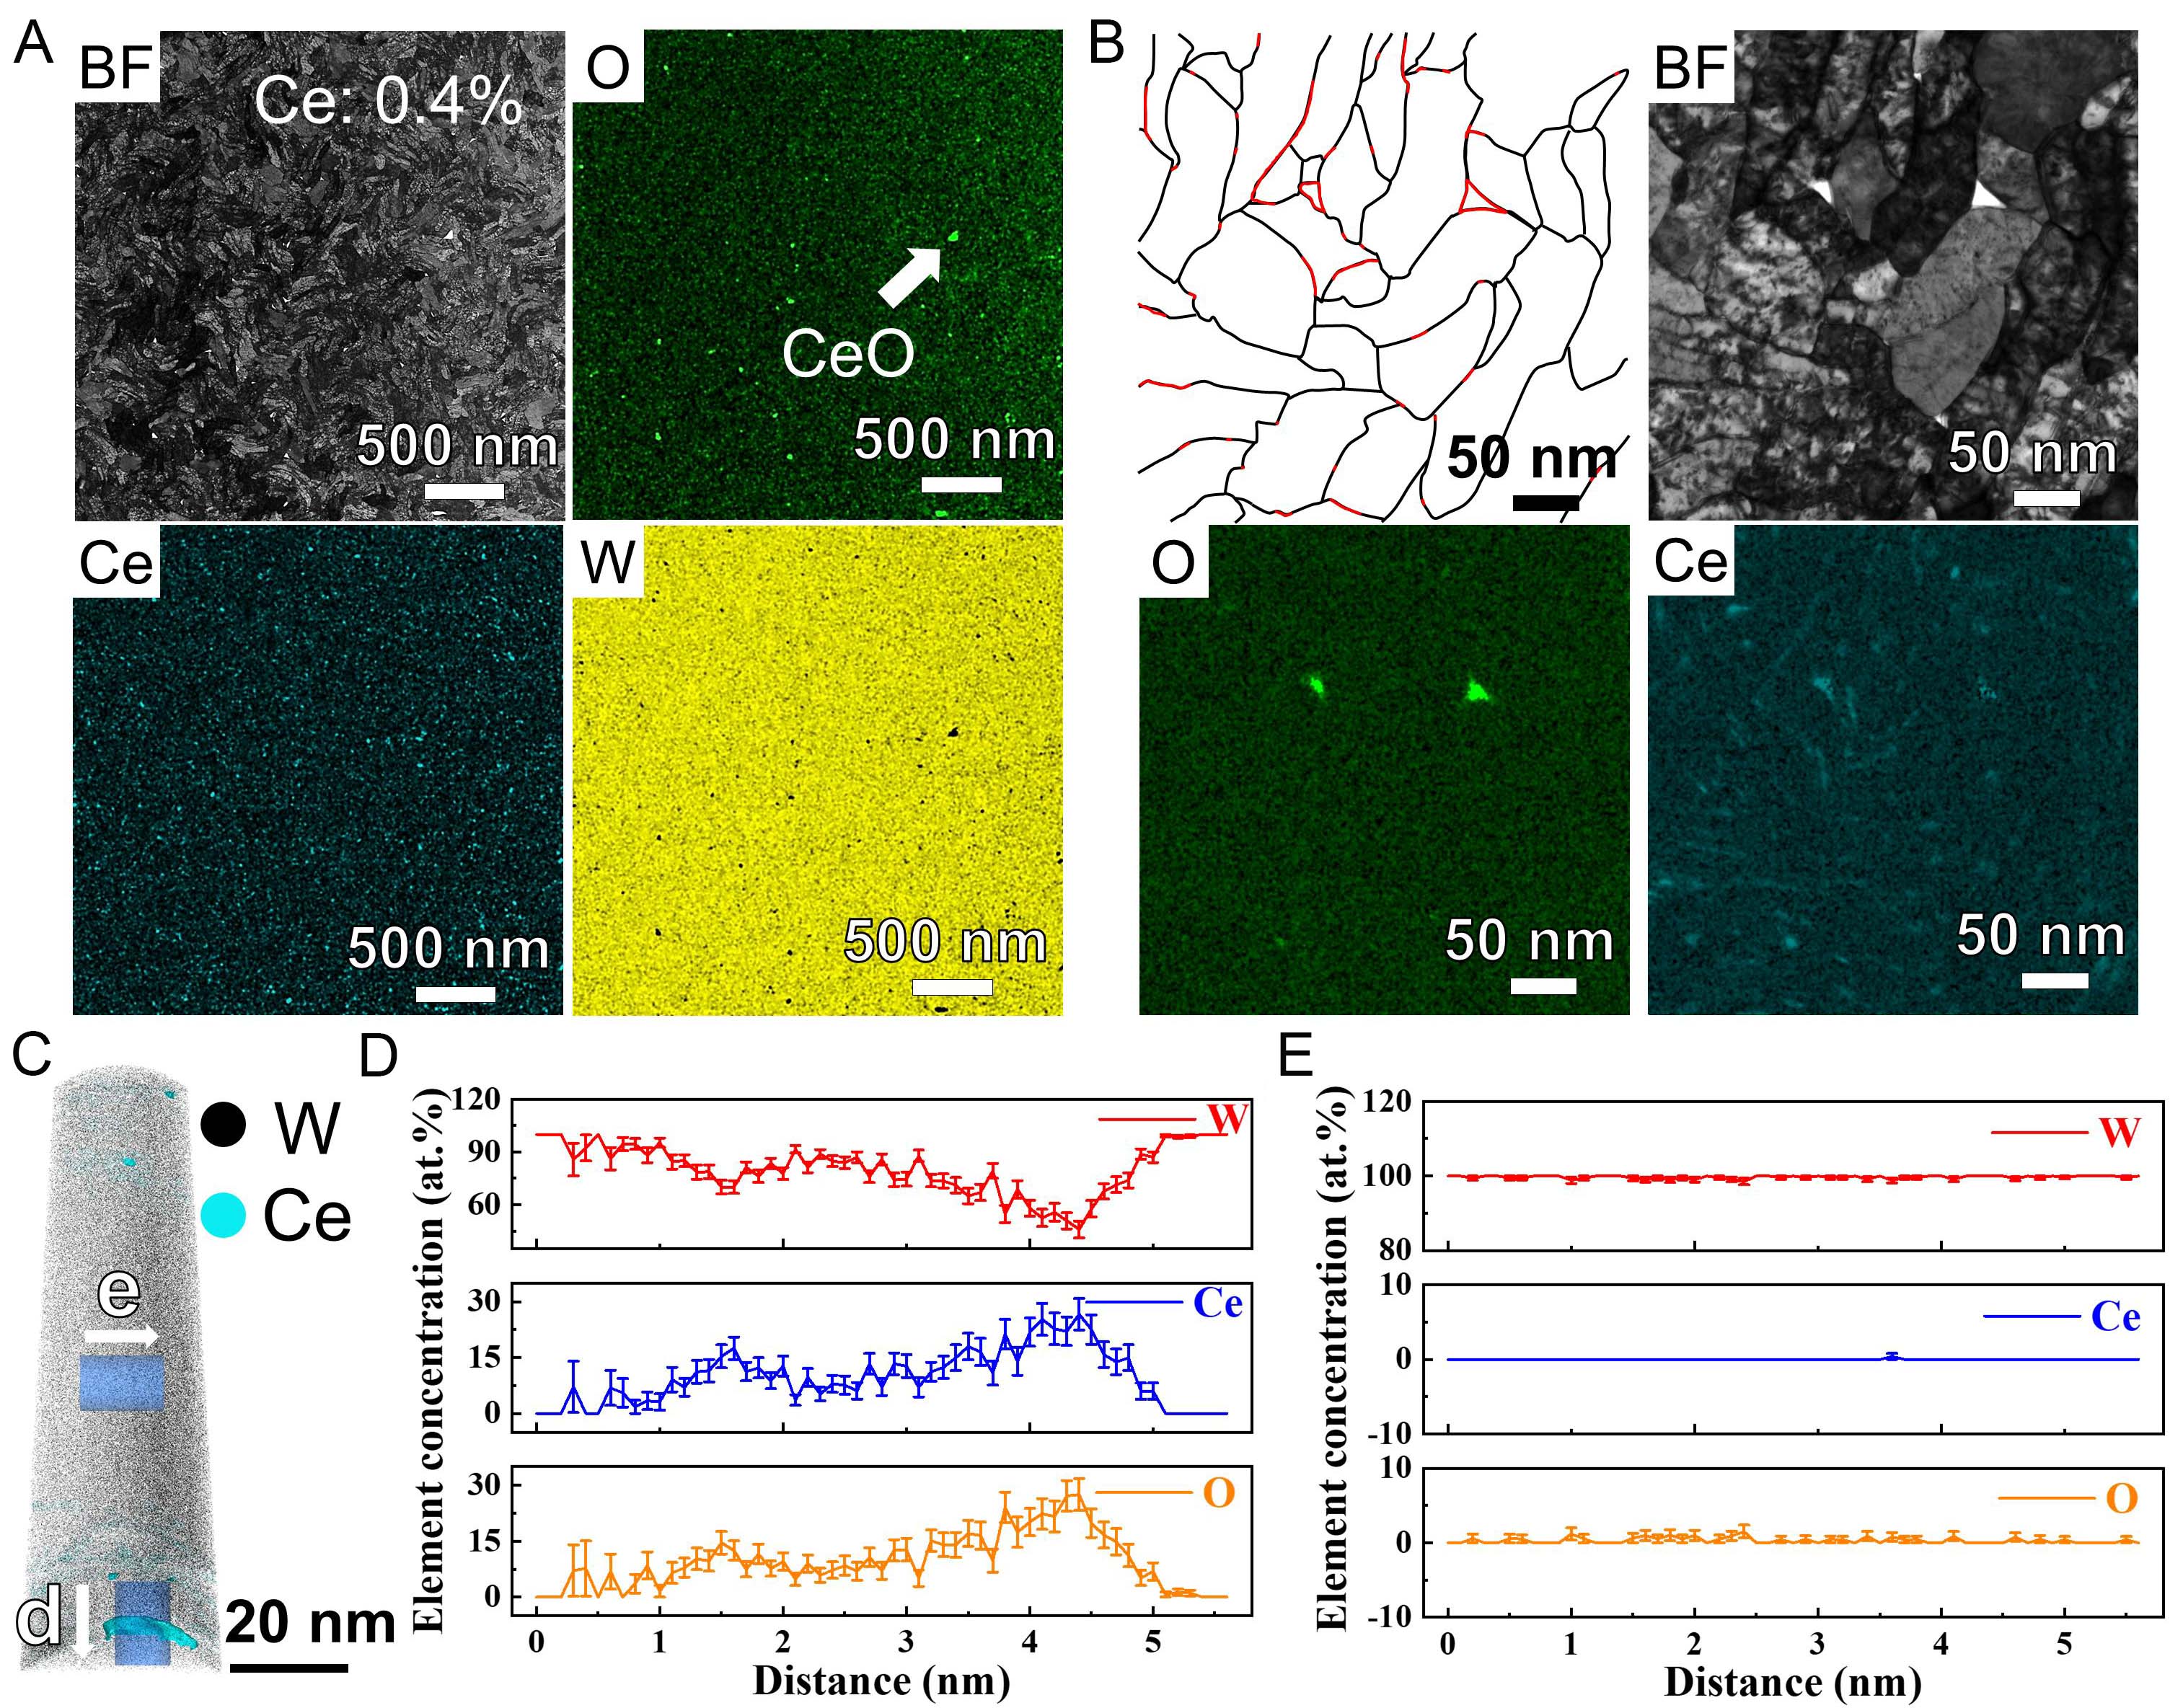
Figure 4. Chemical analyses of tungsten wire: (A and B) Element distribution maps of tungsten wire at ε =4.87 obtained by STEM-EDX on the cross-section of the tungsten wire with a schematic diagram in (B) showing the distribution of CeO on the GBs; (C) 3-D cerium atom maps of tungsten wire with a drawing strain of ε = 4.87, showing a 10 at.% cerium iso-concentration surface (cyan), together with selected regions of interest (ROI); (D and E) concentration profiles for the ROIs in (C) along or perpendicular to the needle direction. The drawing direction is horizontal. The error bars represent the standard deviation (Sigma) of atomic concentration output by CAMECA software.





