

fig2
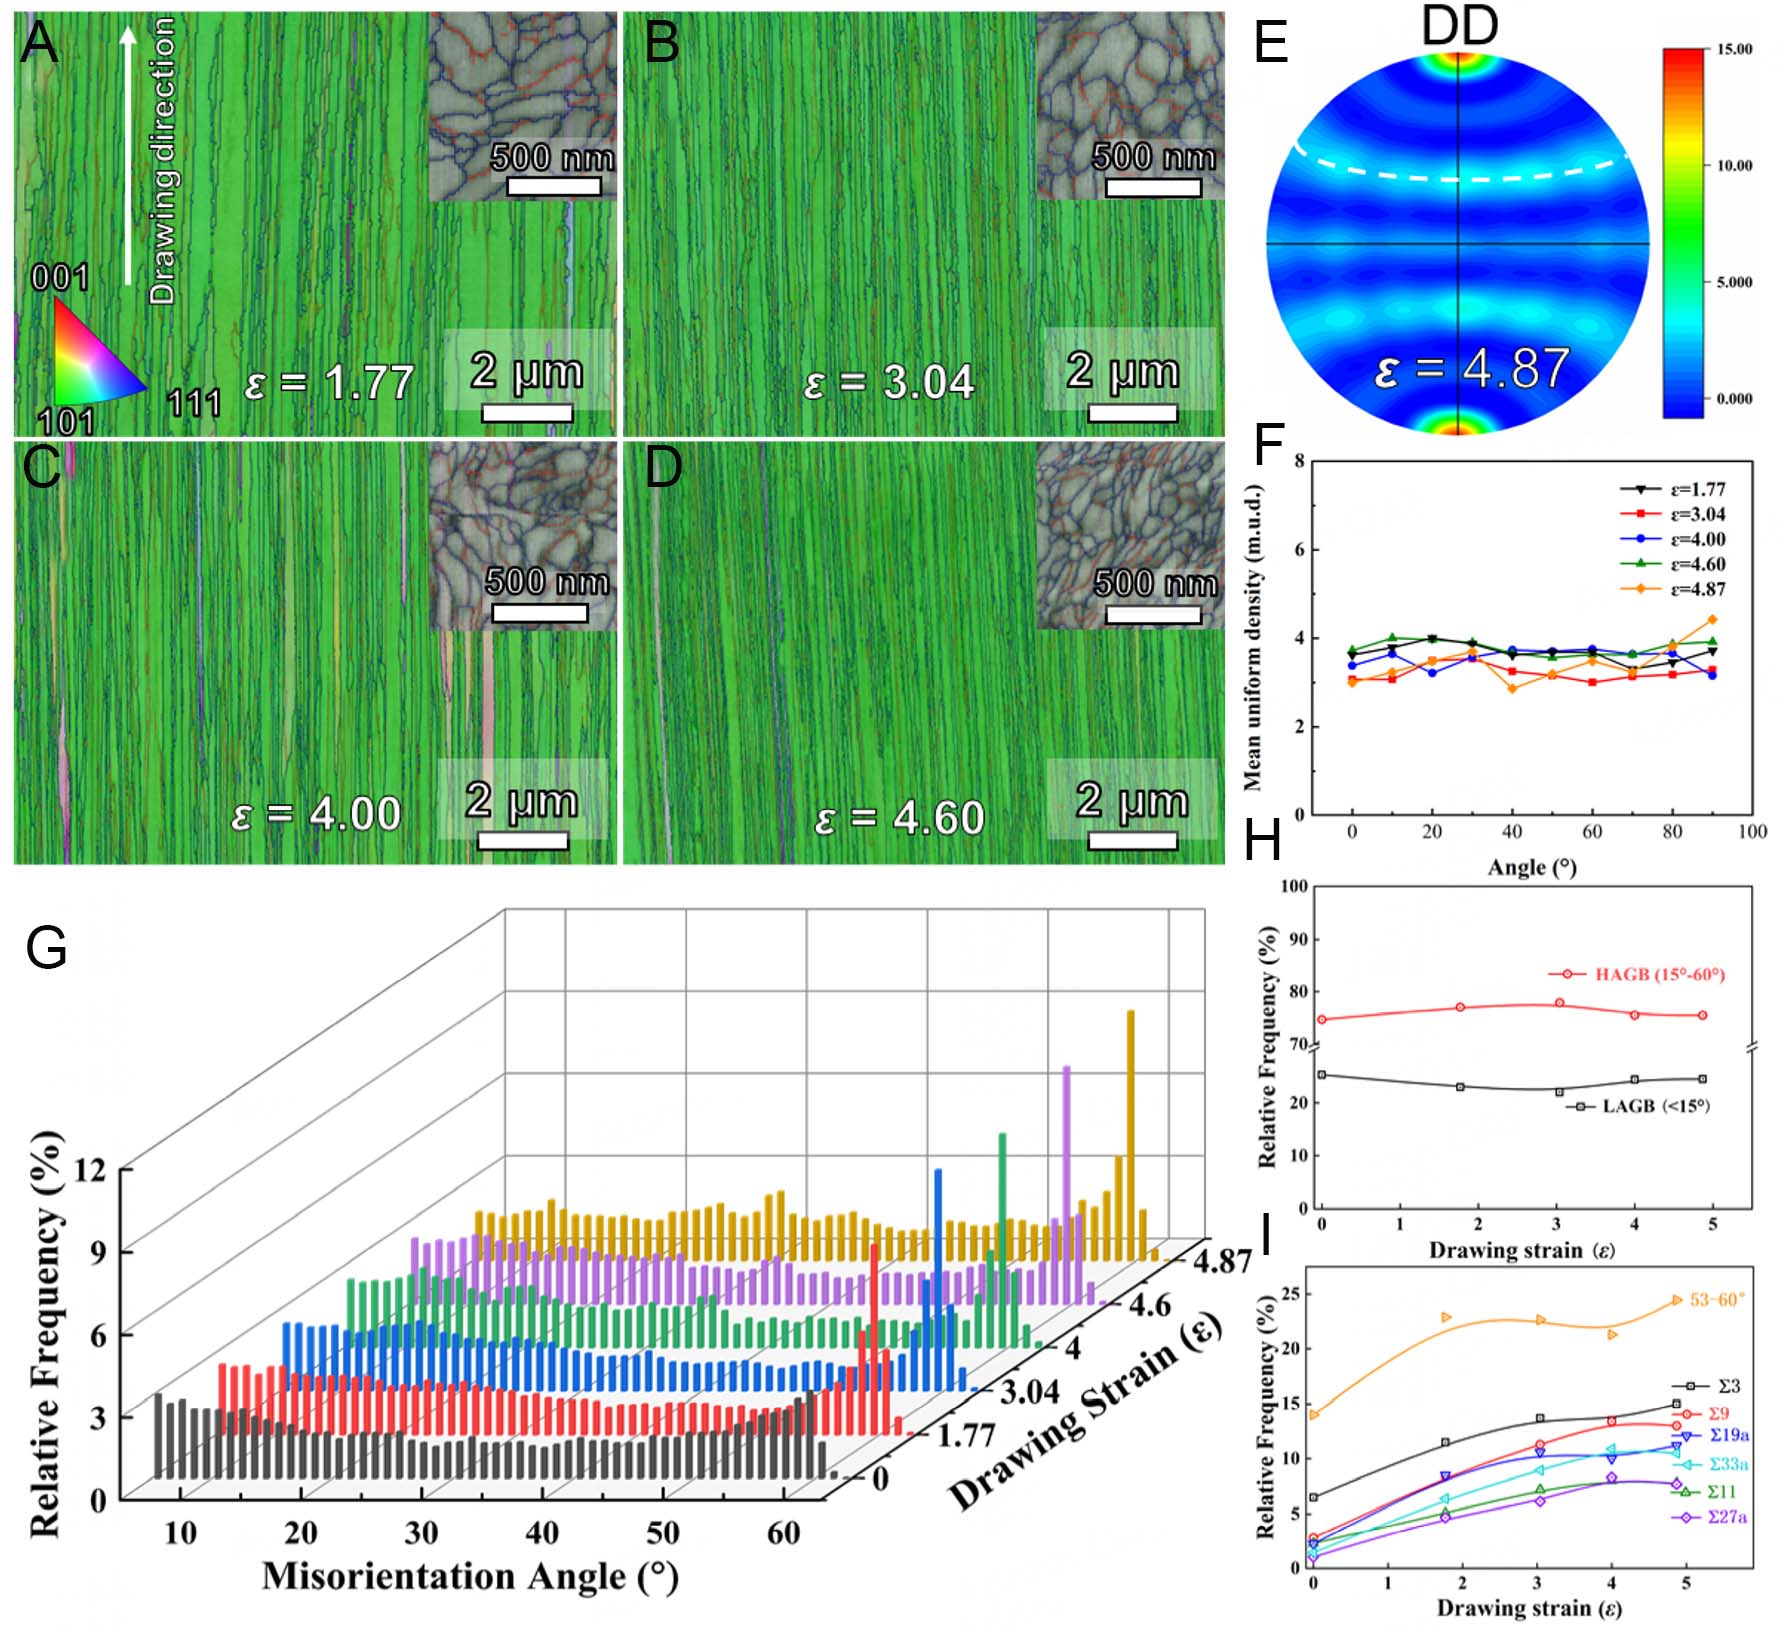
Figure 2. EBSD micrographs (IPF coloring based on the drawing direction) of the longitudinal and cross-sections of the drawn tungsten wire at different strains and texture analysis: (A) ε =1.77; (B) ε = 3.04; (C) ε = 4.00; (D) ε = 4.60; (E) Pole Figure of <110> of the tungsten wire at ε = 4.87 (DD is the drawing direction). (F) The intensity along the dashed line shown in (A) for different strains. The grain boundary characteristics of tungsten wires from EBSD and TKD results: (G) Grain boundary misorientation angle distribution; (H) Percentage of high and low angle grain boundaries; (I) Percentage of high angle grain boundaries with a misorientation of 53°-60° and coincidence site lattice grain boundary. Line in (H and I) are for guiding eye.





