

fig3
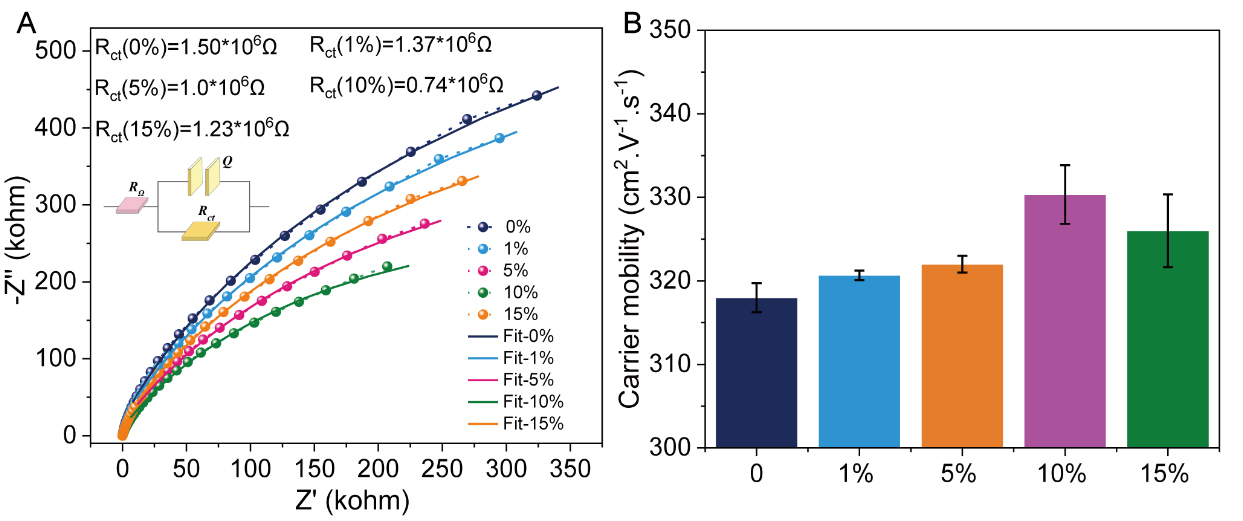
Figure 3. (A) Impedance spectra and (B) carrier mobility of NiOx with different Bi2Te3 concentrations (0, 1, 5, 10, and 15 wt%). Mobility values represent the averages of at least three independent measurements; vertical error bars indicate standard deviation.





