

fig1
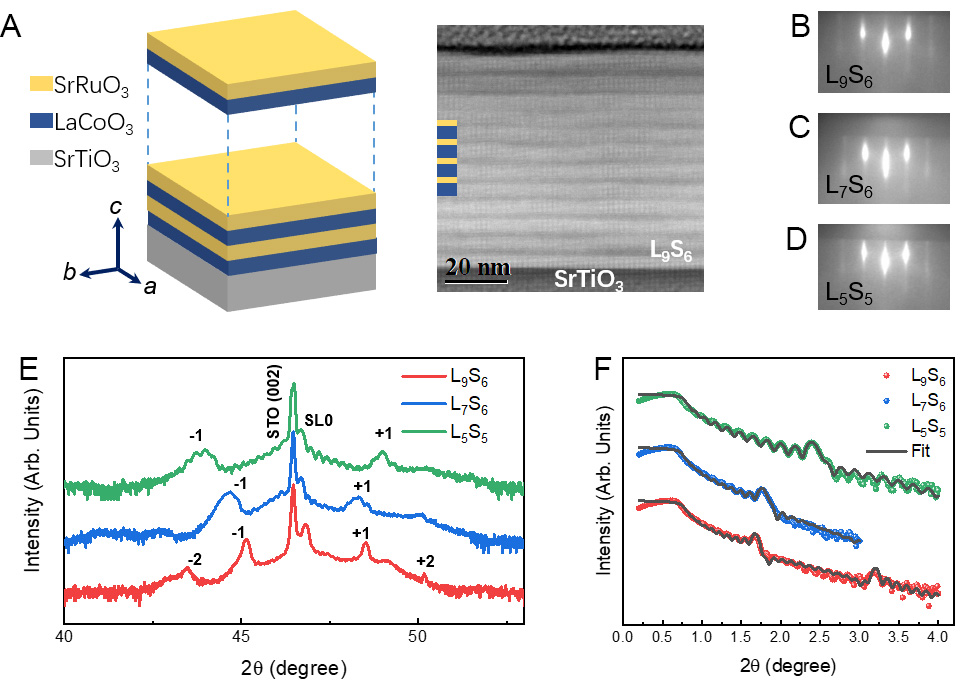
Figure 1. Structural characterization of LCO/SRO superlattices. (A) Schematic illustration of the superlattice structure (left) and cross-sectional STEM image of the L9S6 sample (right), showing atomically sharp interfaces between LCO (blue) and SRO (yellow) layers grown on STO substrate (gray). The scale bar represents 20 nm; (B-D) RHEED patterns along the [100] azimuth for L9S6, L7S6, and L5S5, respectively; (E) XRD θ-2θ scans around the (002) reflection, showing the substrate peak (STO), the superlattice zero-order peak (SL0), and satellite peaks (±1, ±2) arising from the artificial periodicity; (F) XRR data (symbols) and theoretical fits (solid lines) for the three superlattice samples. Well-defined Kiessig oscillations demonstrate an agreement between experimental data and fits for the designed layer thicknesses. LCO: LaCoO3; SRO: SrRuO3; STEM: scanning transmission electron microscopy; XRD: X-ray diffraction; XRR: X-ray reflectivity; STO: SrTiO3.





