

fig7
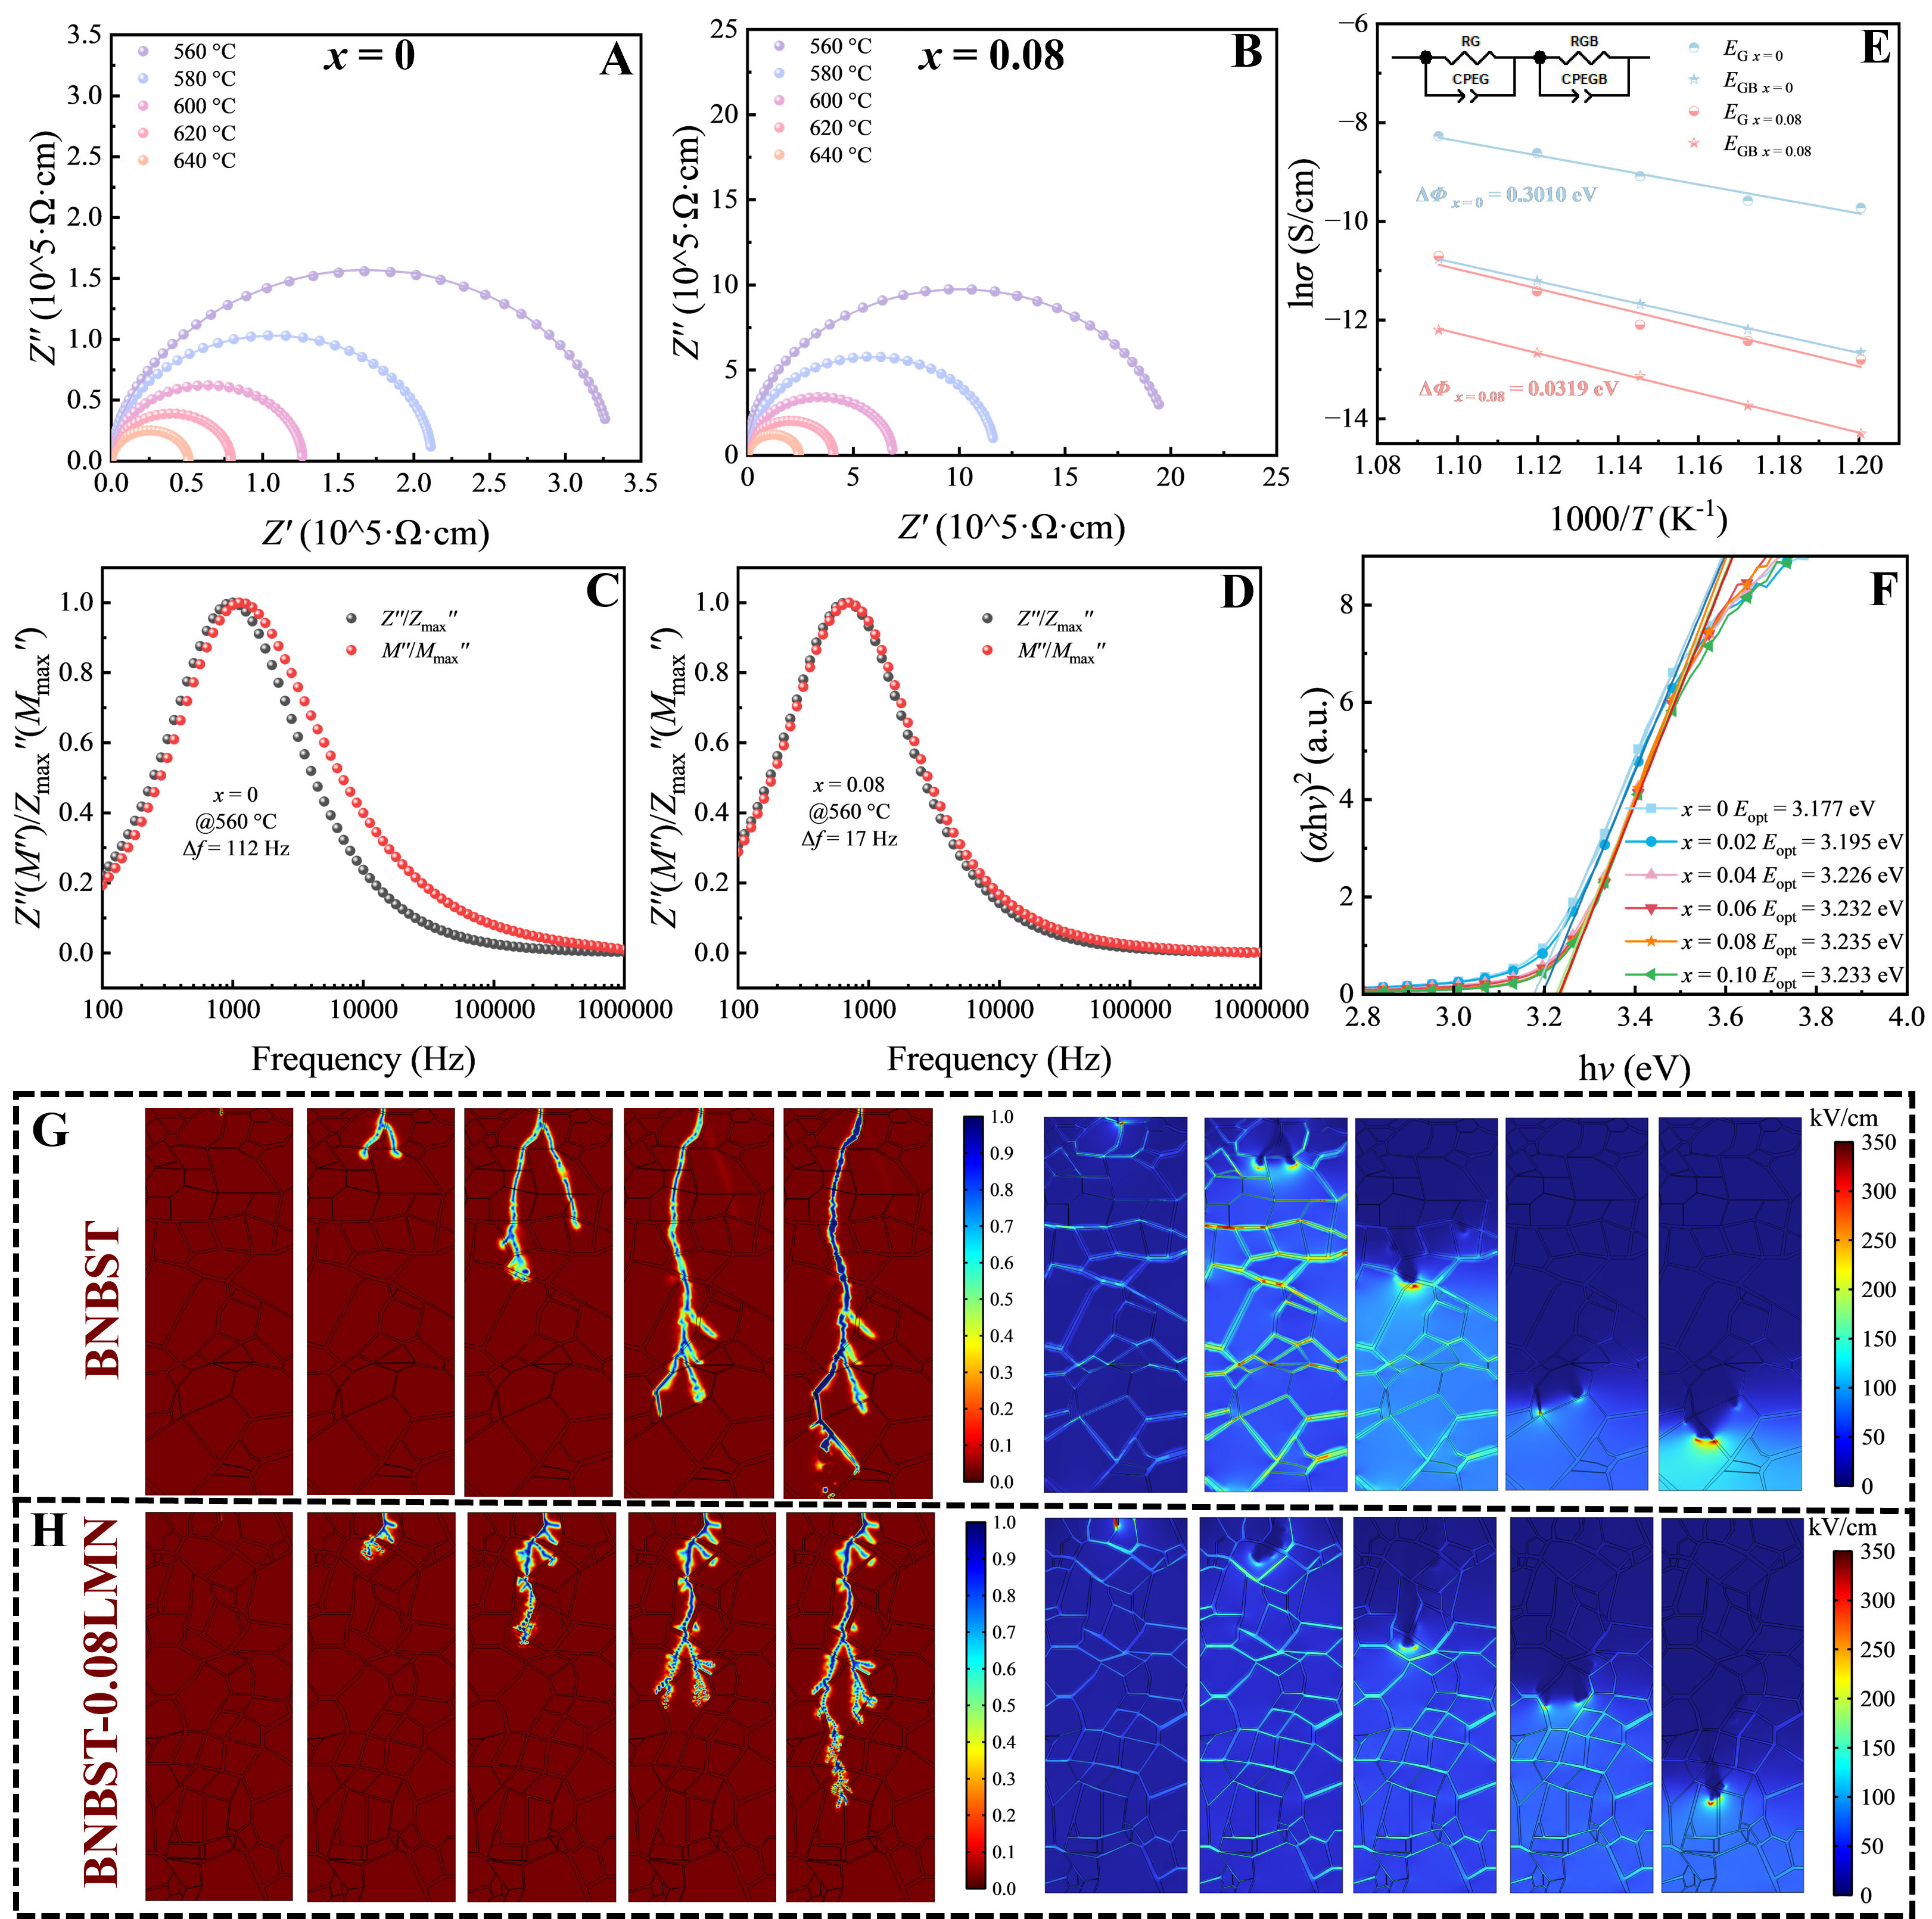
Figure 7. Temperature-dependent complex impedance spectra for the (A) x = 0 and (B) x = 0.08 ceramics. Frequency responses of the Z″ and M″ plots at 560 °C for the (C) x = 0 and (D) x = 0.08 ceramics. (E) Arrhenius plots of the grains and grain boundaries. (F) Tauc plots derived from the UV-Vis absorbance used to calculate Eopt. Finite-element simulation of the electric potential, local electric field, and electric tree propagation at 350 kV/cm for the (G) x = 0 and (H) x = 0.08 ceramics.





