

fig3
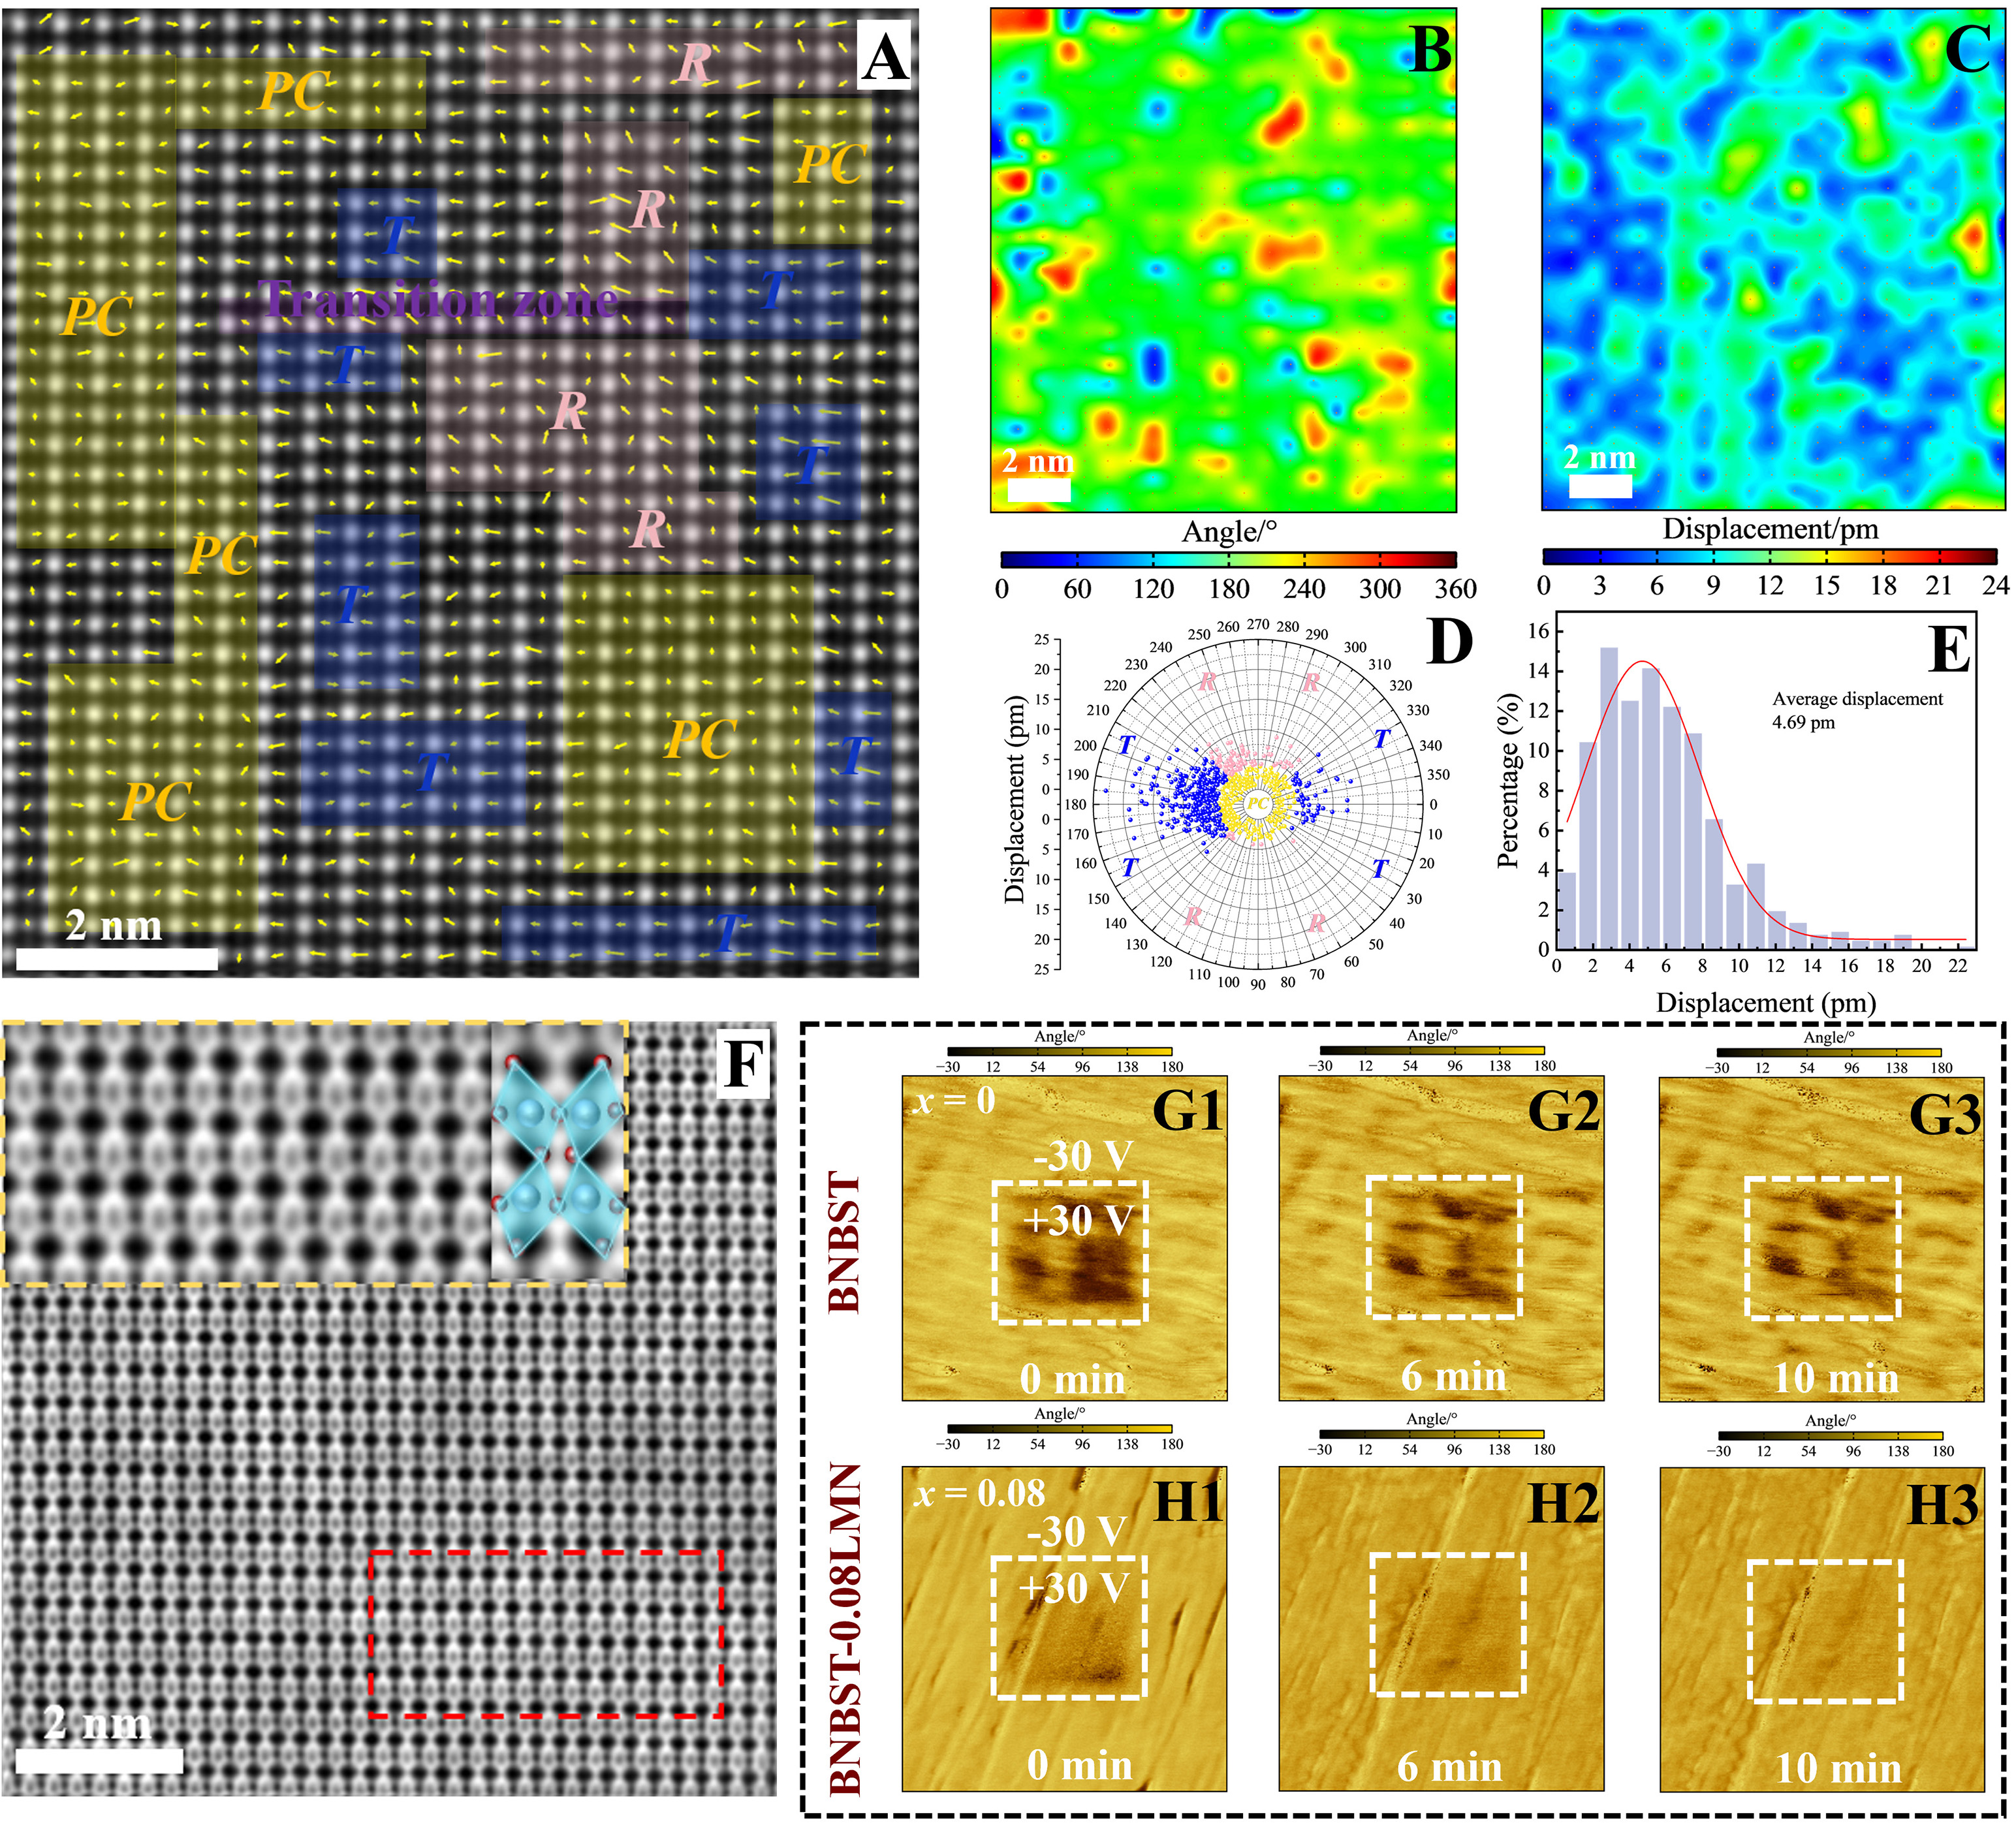
Figure 3. Atomic-scale local structure and dynamic polarization behavior of the x = 0.08 ceramic. (A) Local polarization structure derived from a STEM-HAADF image, showing B-site ion displacement vectors along the [110]c zone axis. (B) Polarization angle and (C) polarization magnitude maps. (D) Polarization projections of B-site cation displacements and (E) statistical distribution of polarization magnitudes. (F) STEM-ABF image obtained along the [110]c direction; the inset highlights the oxygen octahedral tilting. PFM time-dependent phase images of the (G1-G3) x = 0 and (H1-H3) x = 0.08 ceramics.





