

fig12
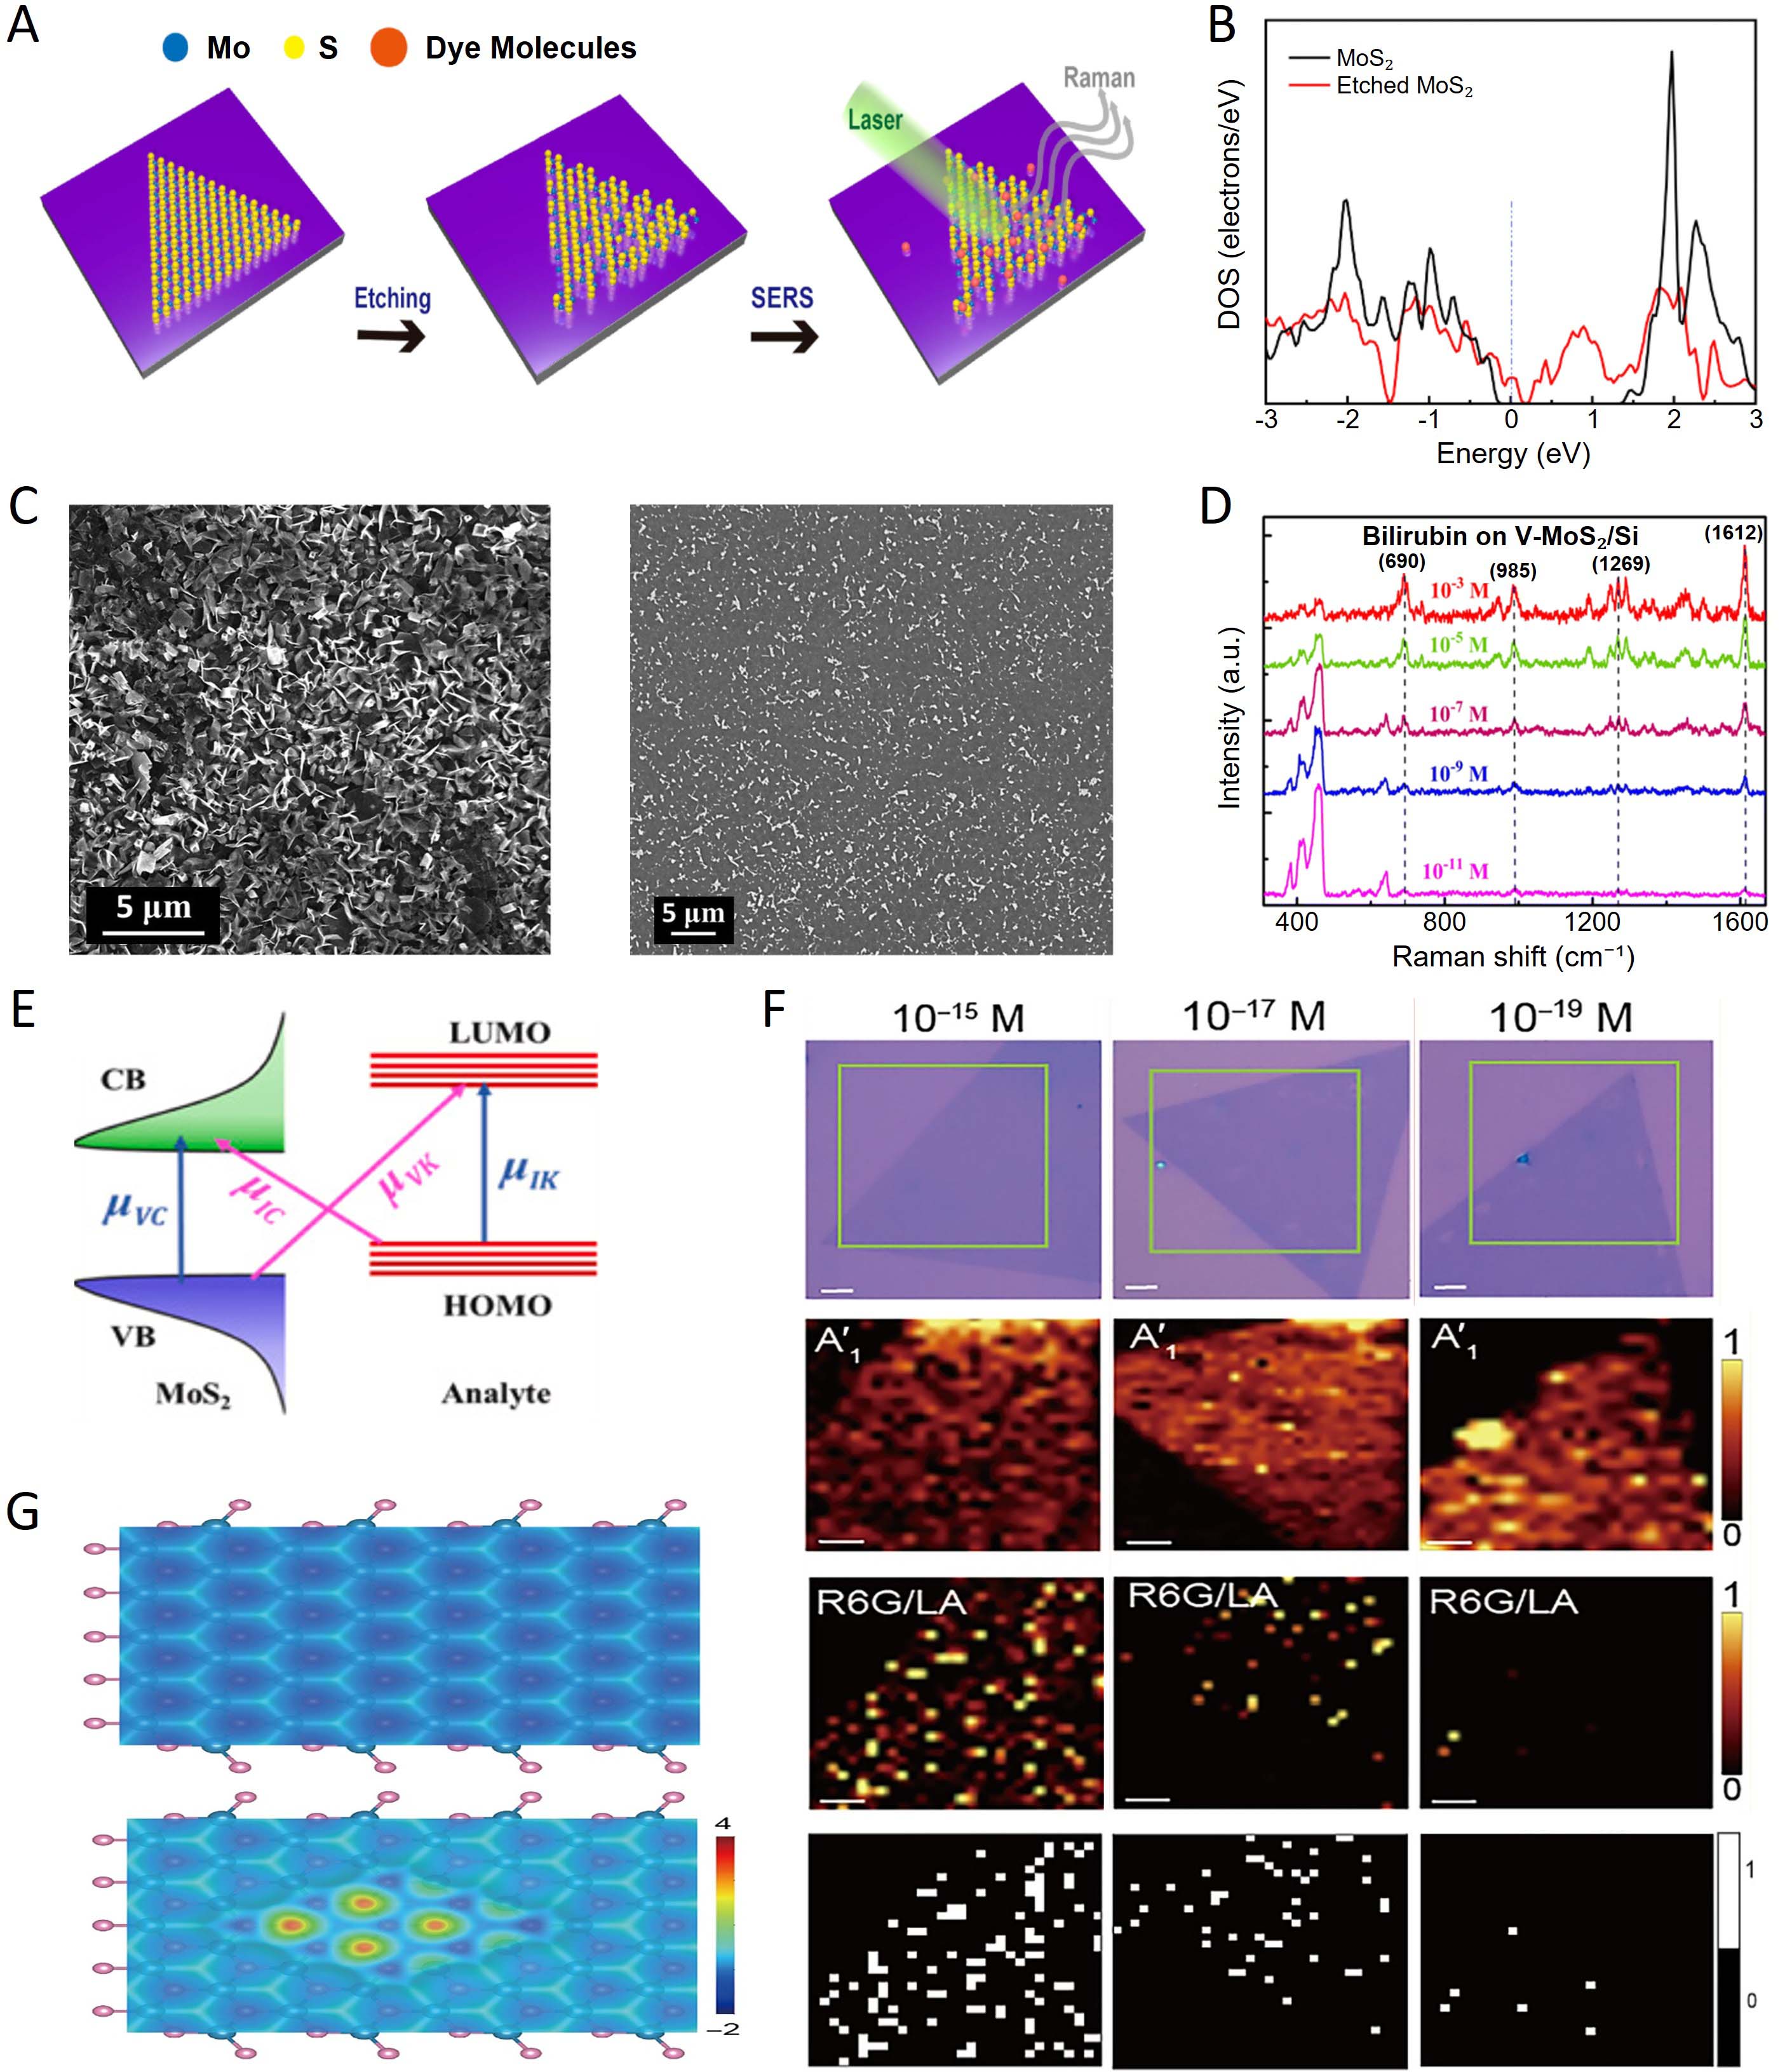
Figure 12. TMD-based SERS. (A) schematic illustration of SERS detection on defect-engineered monolayer MoS2; (B) comparison of Raman spectra and density of states between pristine and defect-rich MoS2. (A and B) are adapted with permission[31]. Copyright 2022, MDPI.; (C) representative SEM images of vertically and horizontally oriented MoS2 nanostructures; (D) SERS spectra of bilirubin on vertical MoS2/Si substrates. (C and D) are adapted with permission[32]. Copyright 2023, Royal Society of Chemistry; (E) electrochemically modulated band diagram illustrating tunable photon-driven charge transfer in MoS2-based EC-SERS systems, adapted with permission[40]. Copyright 2024, Elsevier; (F) combined single-molecule SERS mapping images at ultralow concentrations (10-15 to 10-19 M); (G) DFT electron-density maps comparing pristine and nanopore-engineered WS2, revealing the atomic-scale origin of the enhanced charge-transfer mechanism. (F and G) are adapted with permission[41]. Copyright 2025, American Association for the Advancement of Science. CB: conduction band; VB: valence band; HOMO: highest occupied molecular orbital; LOMO: lowest occupied molecular orbital.





