
fig6
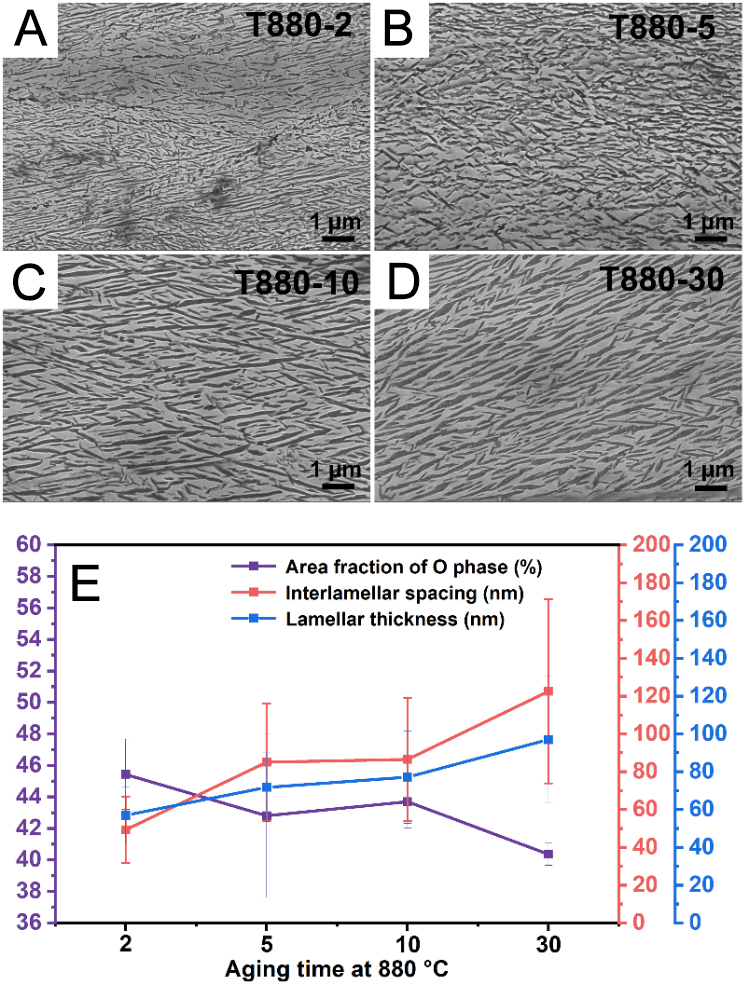
Figure 6. SEM images of the cold-rolled alloy after aging at 880 °C for (A) 2, (B) 5, (C) 10, and (D) 30 min, and (E) statistical charts of the O-phase area fraction, interlamellar spacing, and lamellar thickness. The error bars represent the standard deviation (SD), with n = 5. SEM: Scanning electron microscopy.