
fig14
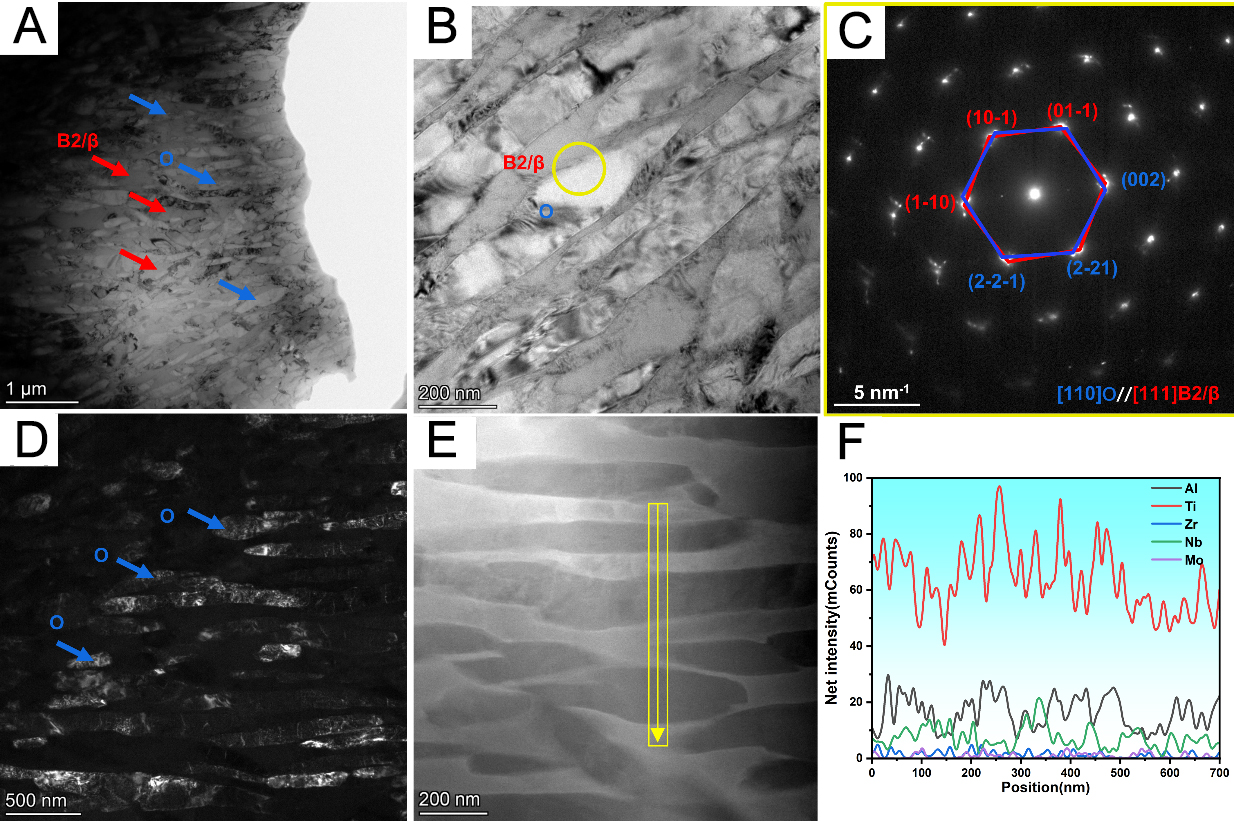
Figure 14. (A and B) Bright-field images, (C) SAED pattern taken at the B2/β-O interface, (D) dark-field image of the O phase, (E) HAADF image, and (F) EDS line scan analysis perpendicular to the lamellae of the T880-30 sample. SAED: Selected-area electron diffraction; HAADF: high-angle annular dark-field; EDS: energy-dispersive X-ray spectroscopy.