
fig4
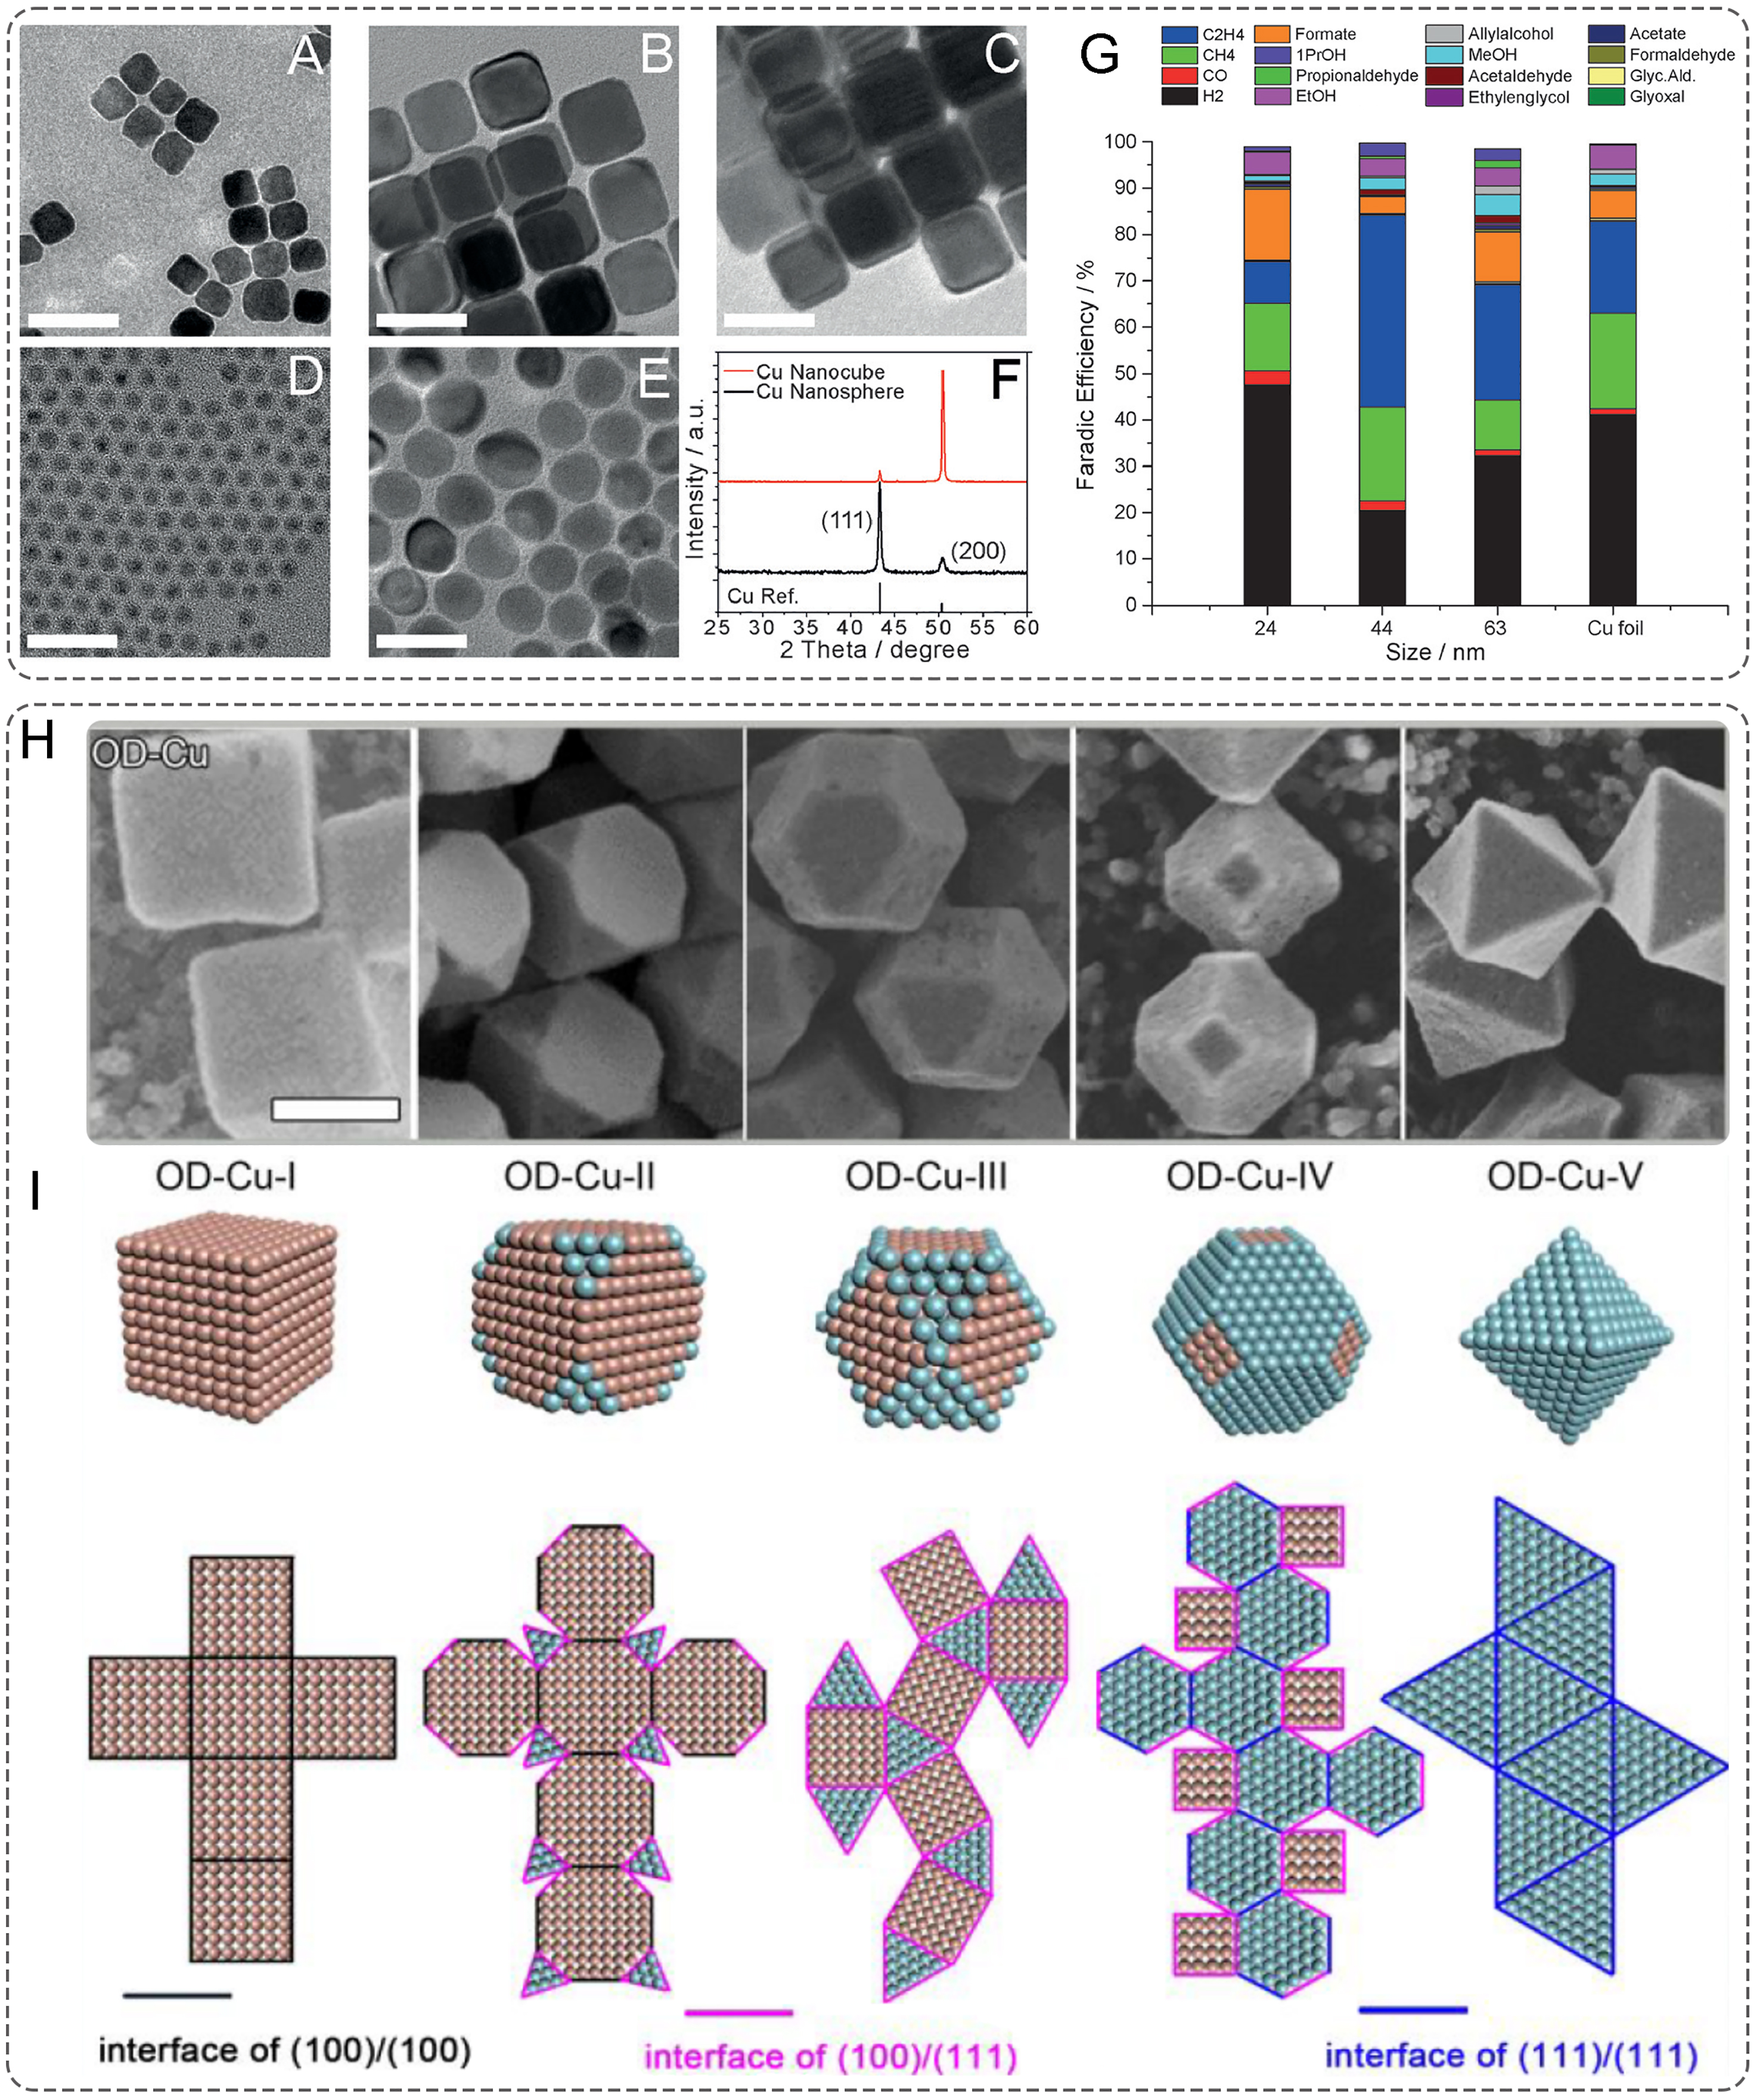
Figure 4. (A-C) TEM images of Cu cubes with an average edge length of 24, 44, 63 nm, respectively; (D and E) TEM images of Cu spheres with an average diameter of 7.5 and 27 nm, respectively. Scale bar 50 nm; (F) Typical XRD patterns of the Cu spheres (black line) and Cu cubes (red line); (G) Bar graph reporting the FEs for each product in the different sizes of Cu cubes and in the Cu foil at -1.1 V vs. RHE. (A-G) Reproduced with permission[23]. Copyright 2016, Wiley-VCH; (H) SEM images and (I) corresponding structure of OD-Cu derived from Cu2O crystals. Scale bar, 400 nm. (H and I) Reproduced with permission[65]. Copyright 2022, American Chemical Society. TEM: Transmission electron microscopy; FEs: Faradaic efficiencies; XRD: X-ray diffraction; SEM: Scanning electron microscopy.