


fig2
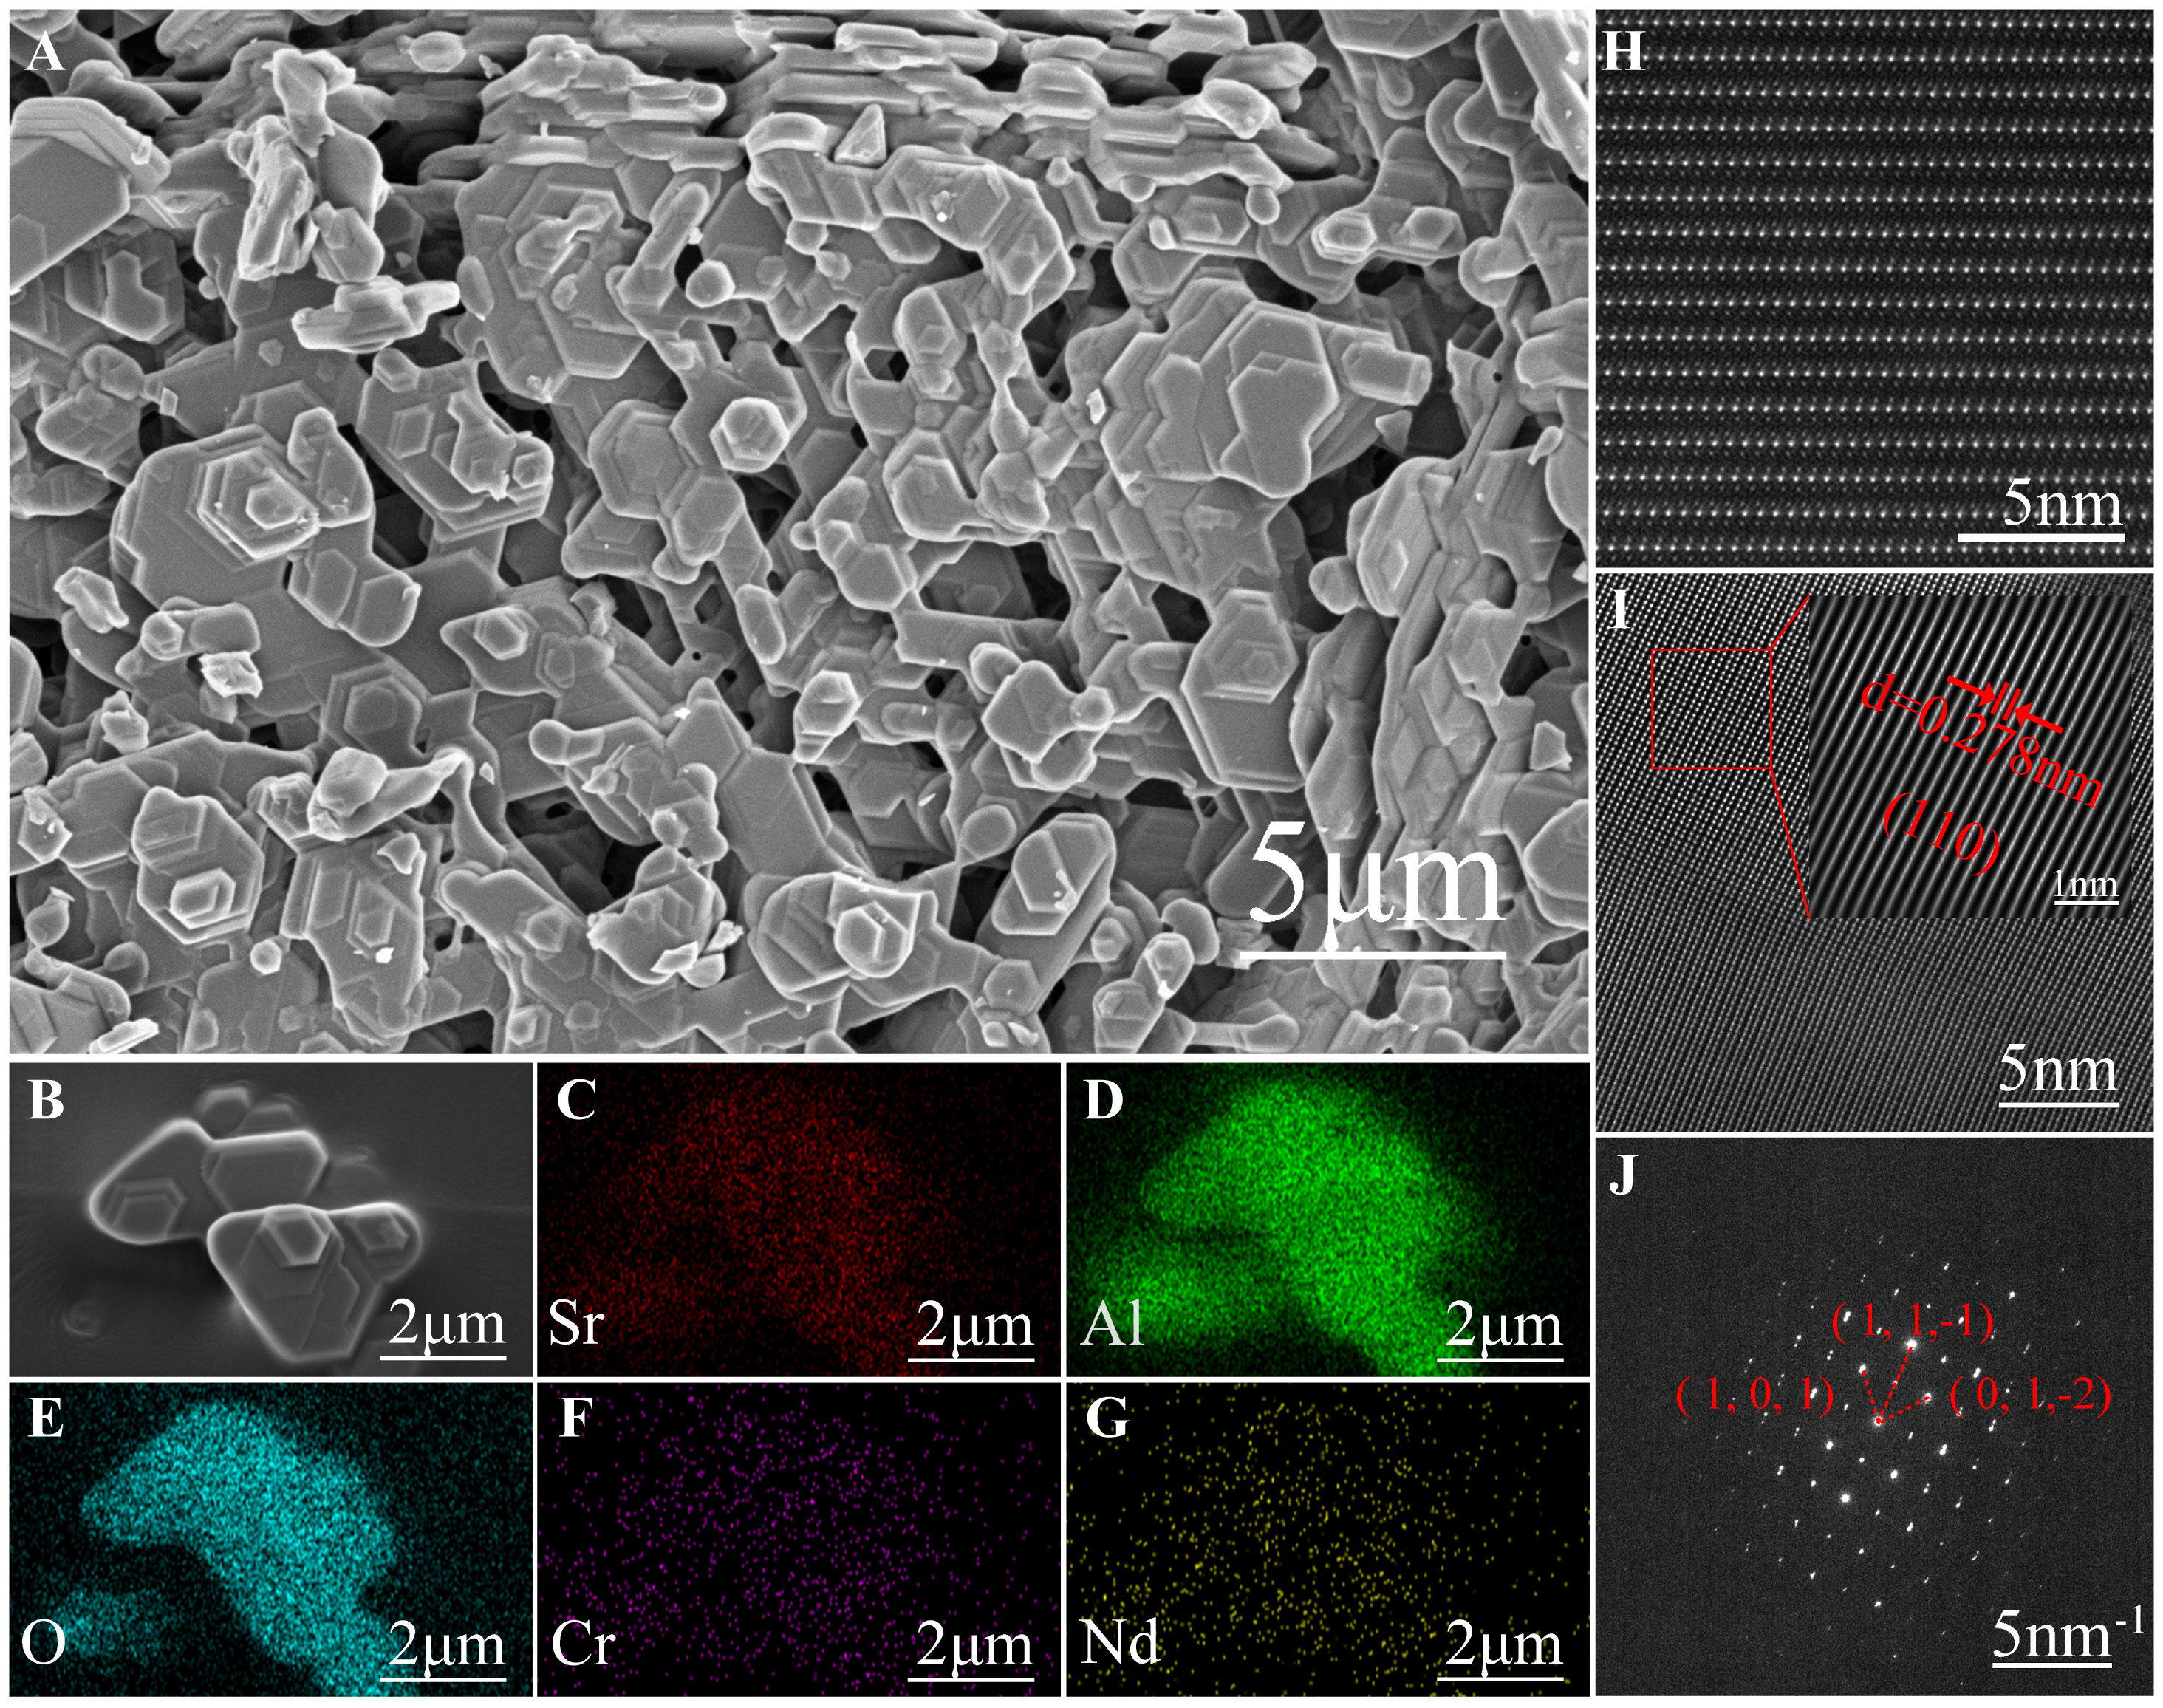
Figure 2. (A) SEM image of SrAl12O19:2%Cr3+ sample; (B-G) SEM image and element mappings of SrAl12O19:2%Cr3+, 1%Nd3+ sample; (H) High-resolution TEM image of SrAl12O19:2%Cr3+; (I) Fourier transform image of the selected region for SrAl12O19:2%Cr3+; (J) Selected area electron diffraction image of SrAl12O19:2%Cr3+. SEM: Scanning electron microscope; TEM: transmission electron microscopy.


