


fig4
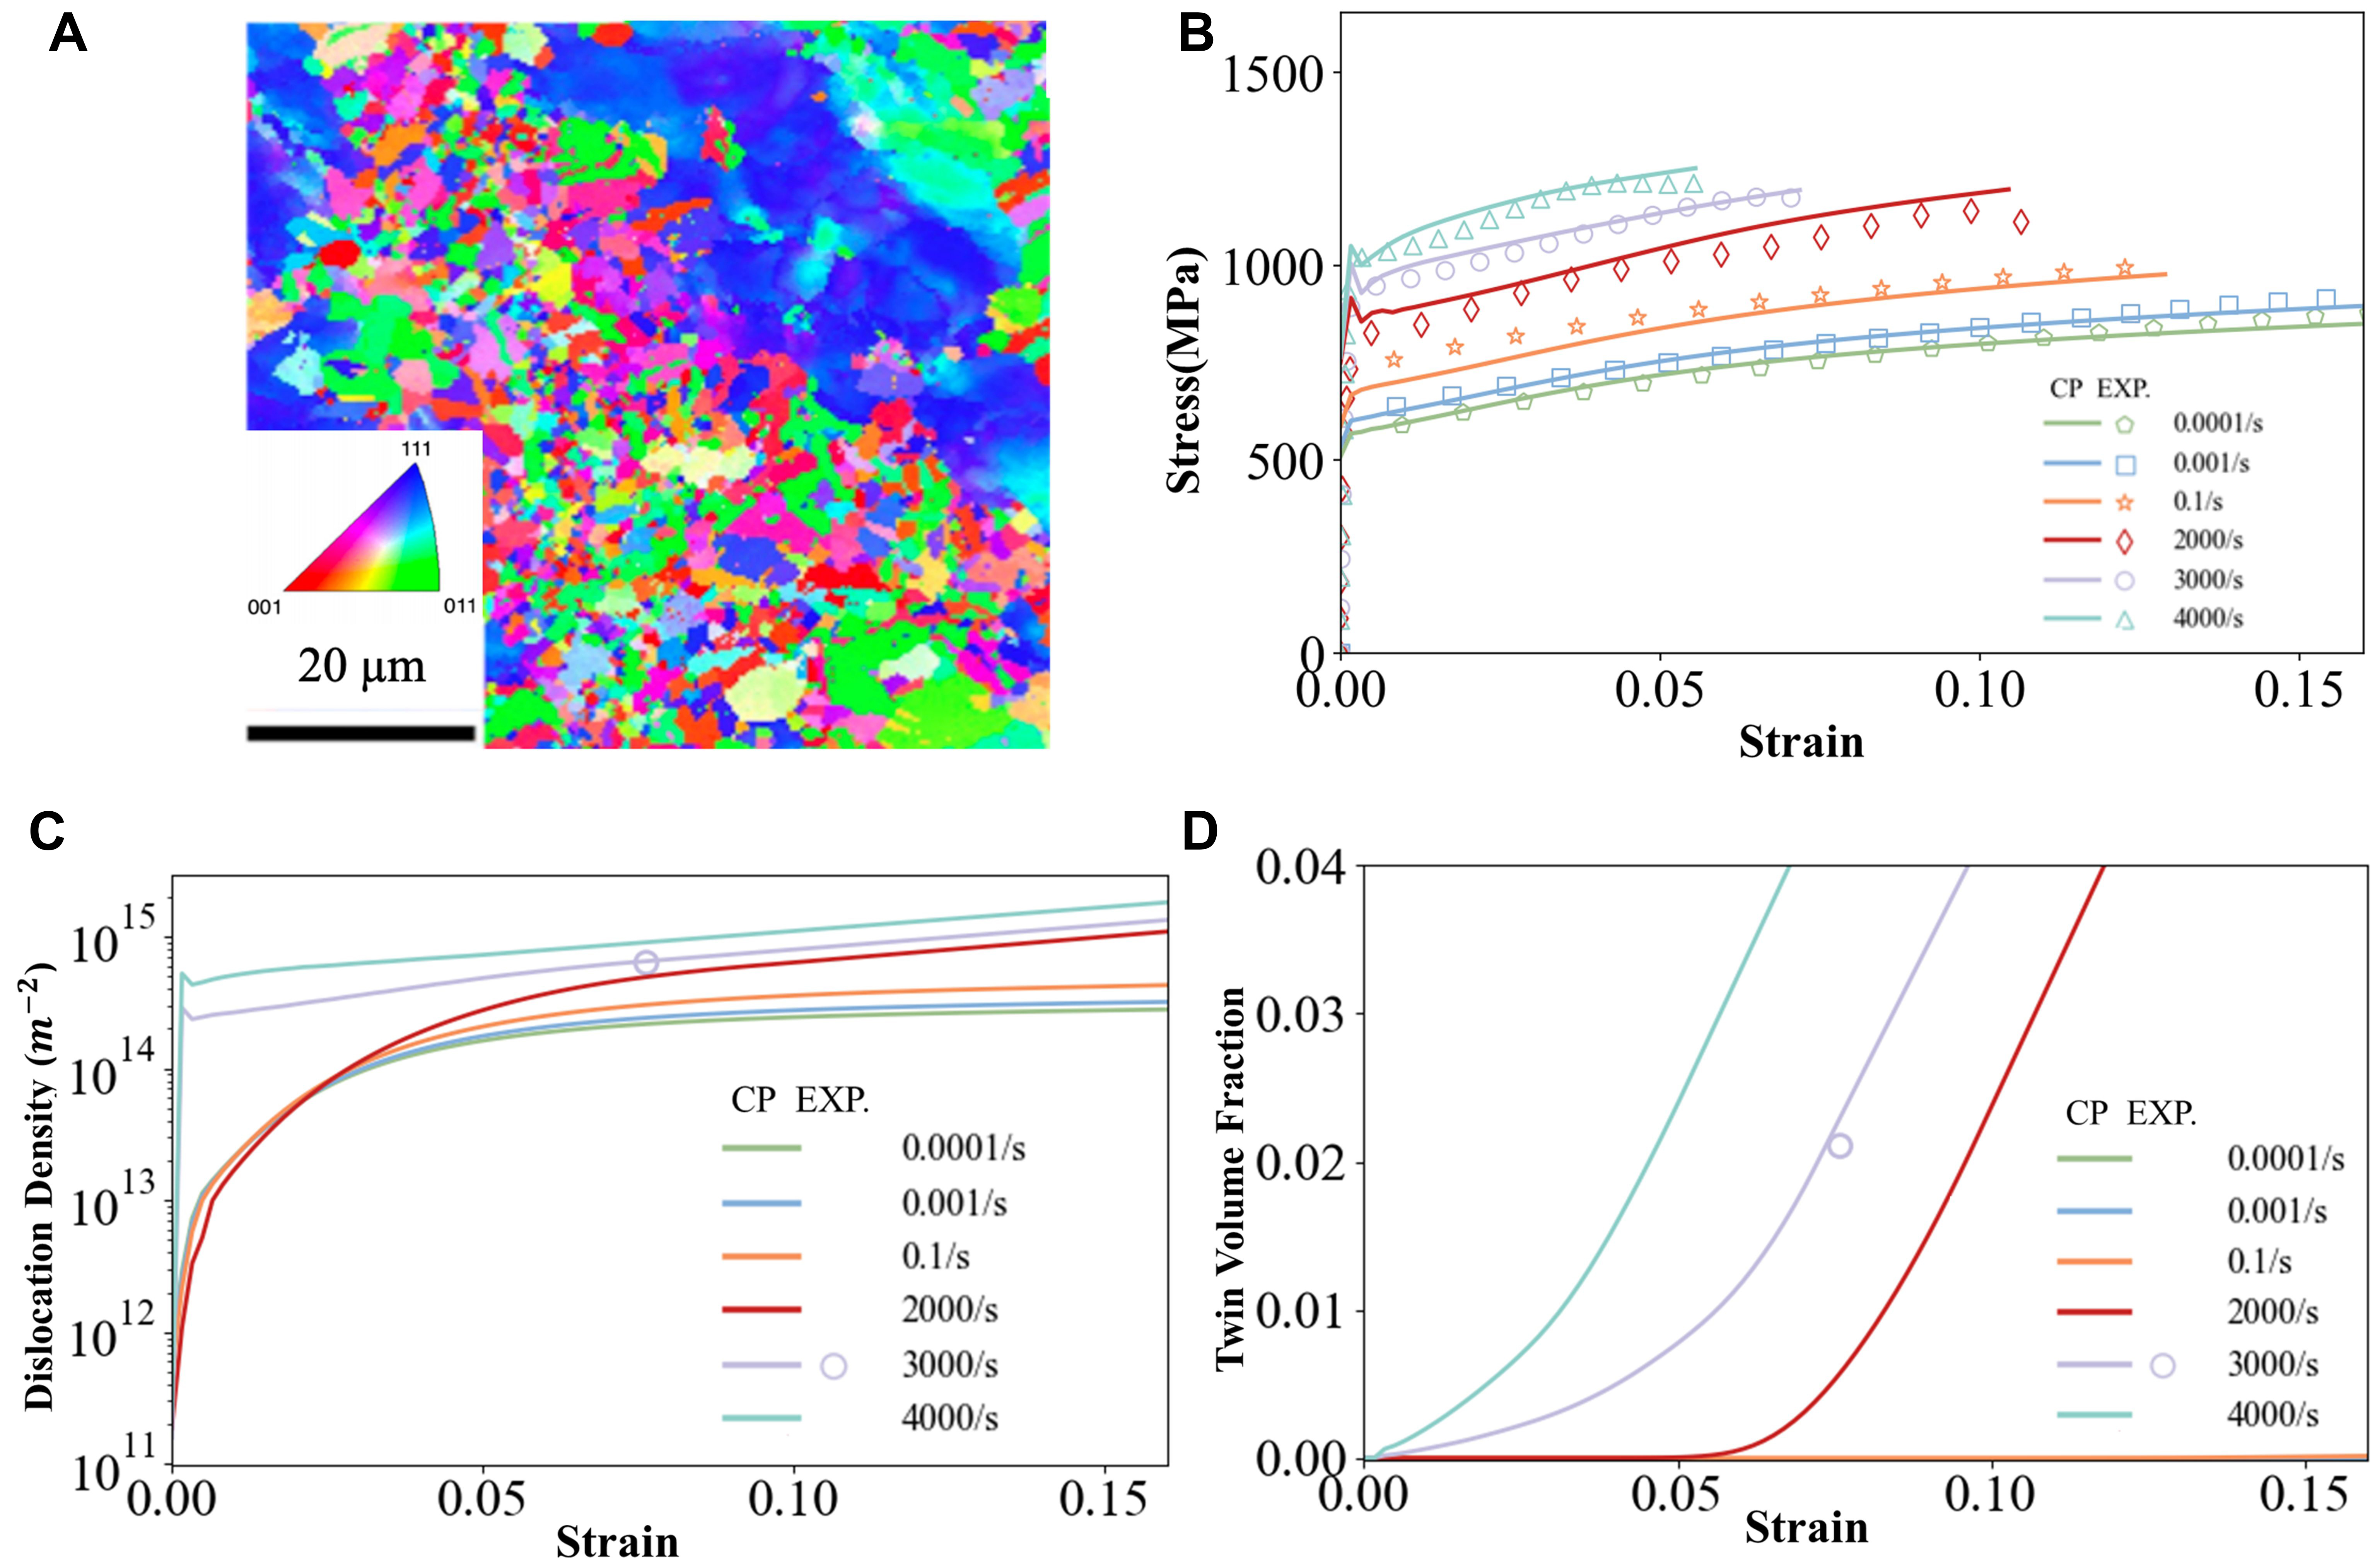
Figure 4. (A) Electron backscatter diffraction map illustrating the initial texture of the CrFeNi alloy prior to deformation, depicted through an inverse pole figure color scheme[26]; (B-D) Comparison of the mechanical response predictions including stress, DD and twin volume fraction derived from crystal plasticity (CP) simulations to experimental (Exp.) measurements obtained at varying strain rates. Experimental results adapted from Wang et al.’s study[26].


