
fig7
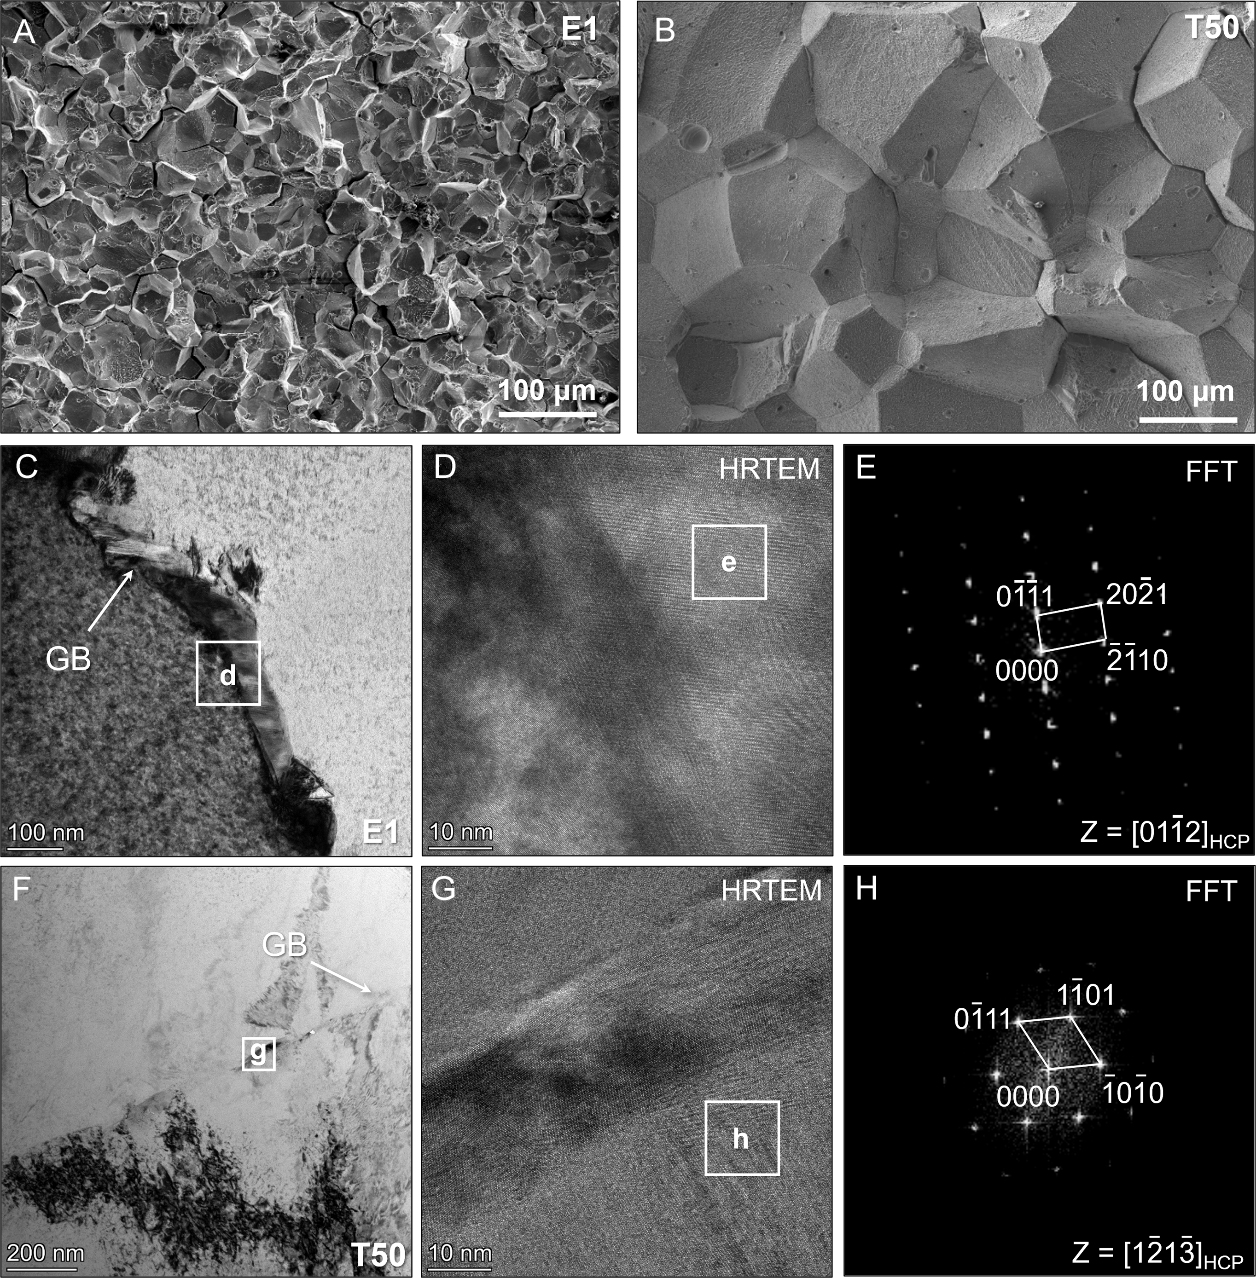
Figure 7. The fractography and GB phases of the LMD E1 and T50 alloys. (A and B) SEM-SE images showing the fractography of E1 and T50, respectively; (C) BF-TEM image showing a GB phase in E1; (D and E) HRTEM image and corresponding FFT pattern of the GB phase in E1; (F) BF-TEM image showing a GB phase in T50; (G and H) HRTEM image and corresponding FFT pattern of the GB phase in T50. GB: Grain boundarie; LMD: laser metal deposition; BF-TEM: bright-field TEM; TEM: transmission electron microscope; HRTEM: high-resolution transmission electron microscopy; SEM-SE: scanning electron microscopy - secondary electrons; FFT: fast fourier transform.