
fig5
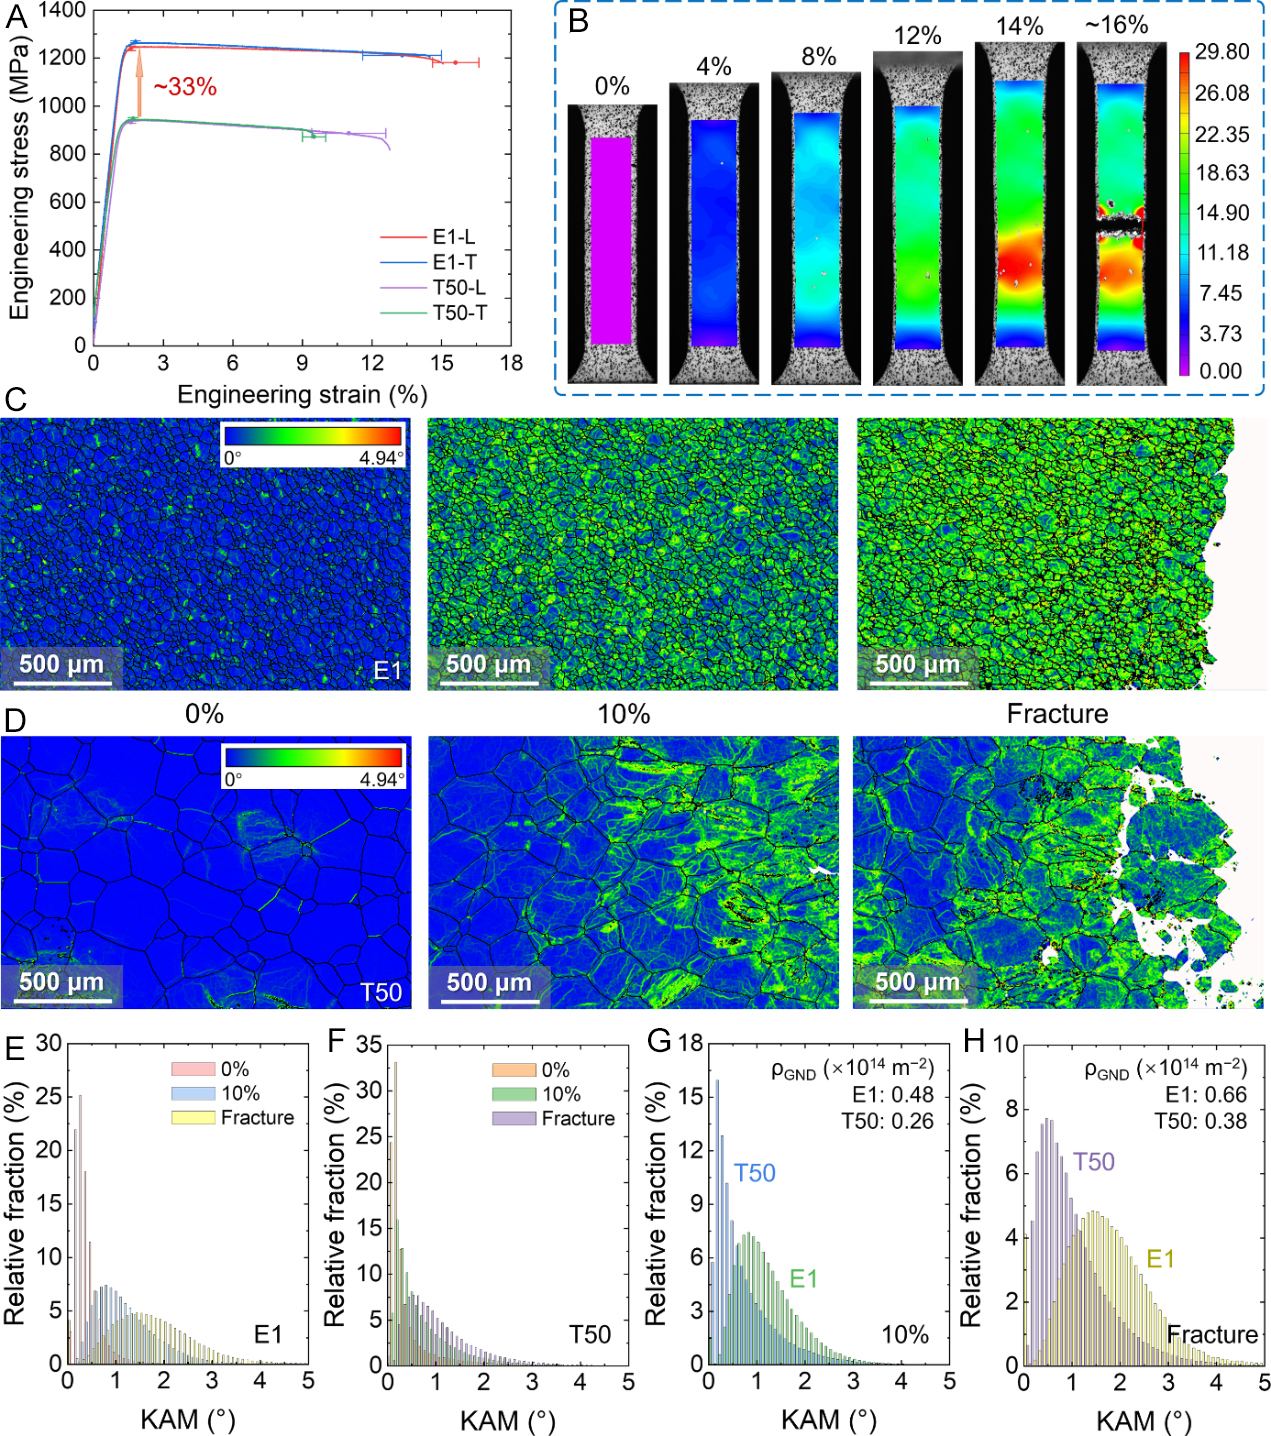
Figure 5. Mechanical behavior of the LMD E1 and T50. (A) Tensile engineering stress-strain curves of the E1 and T50 alloys loaded along different directions. The error bars along the strain and stress axes indicate the standard deviations of fracture strain and yield strength, respectively, from at least three independent tensile tests for each condition; (B) DIC analysis for E1 loaded along L directions; (C and D) KAM distribution of E1 and T50, respectively, at different strain levels (0%, 10% and the strain at fracture); (E and F) Statistics of the relative KAM fraction of grains in E1 and T50, respectively, at different strain levels (0%, 10%, and the strain at fracture); (G and H) Comparison of the relative KAM fraction and GND densities between E1 and T50 at 10% strain and the strain at fracture, respectively. LMD: Laser metal deposition; DIC: digital image correlation; KAM: kernel average misorientation; GND: geometrically necessary dislocation.