
fig3
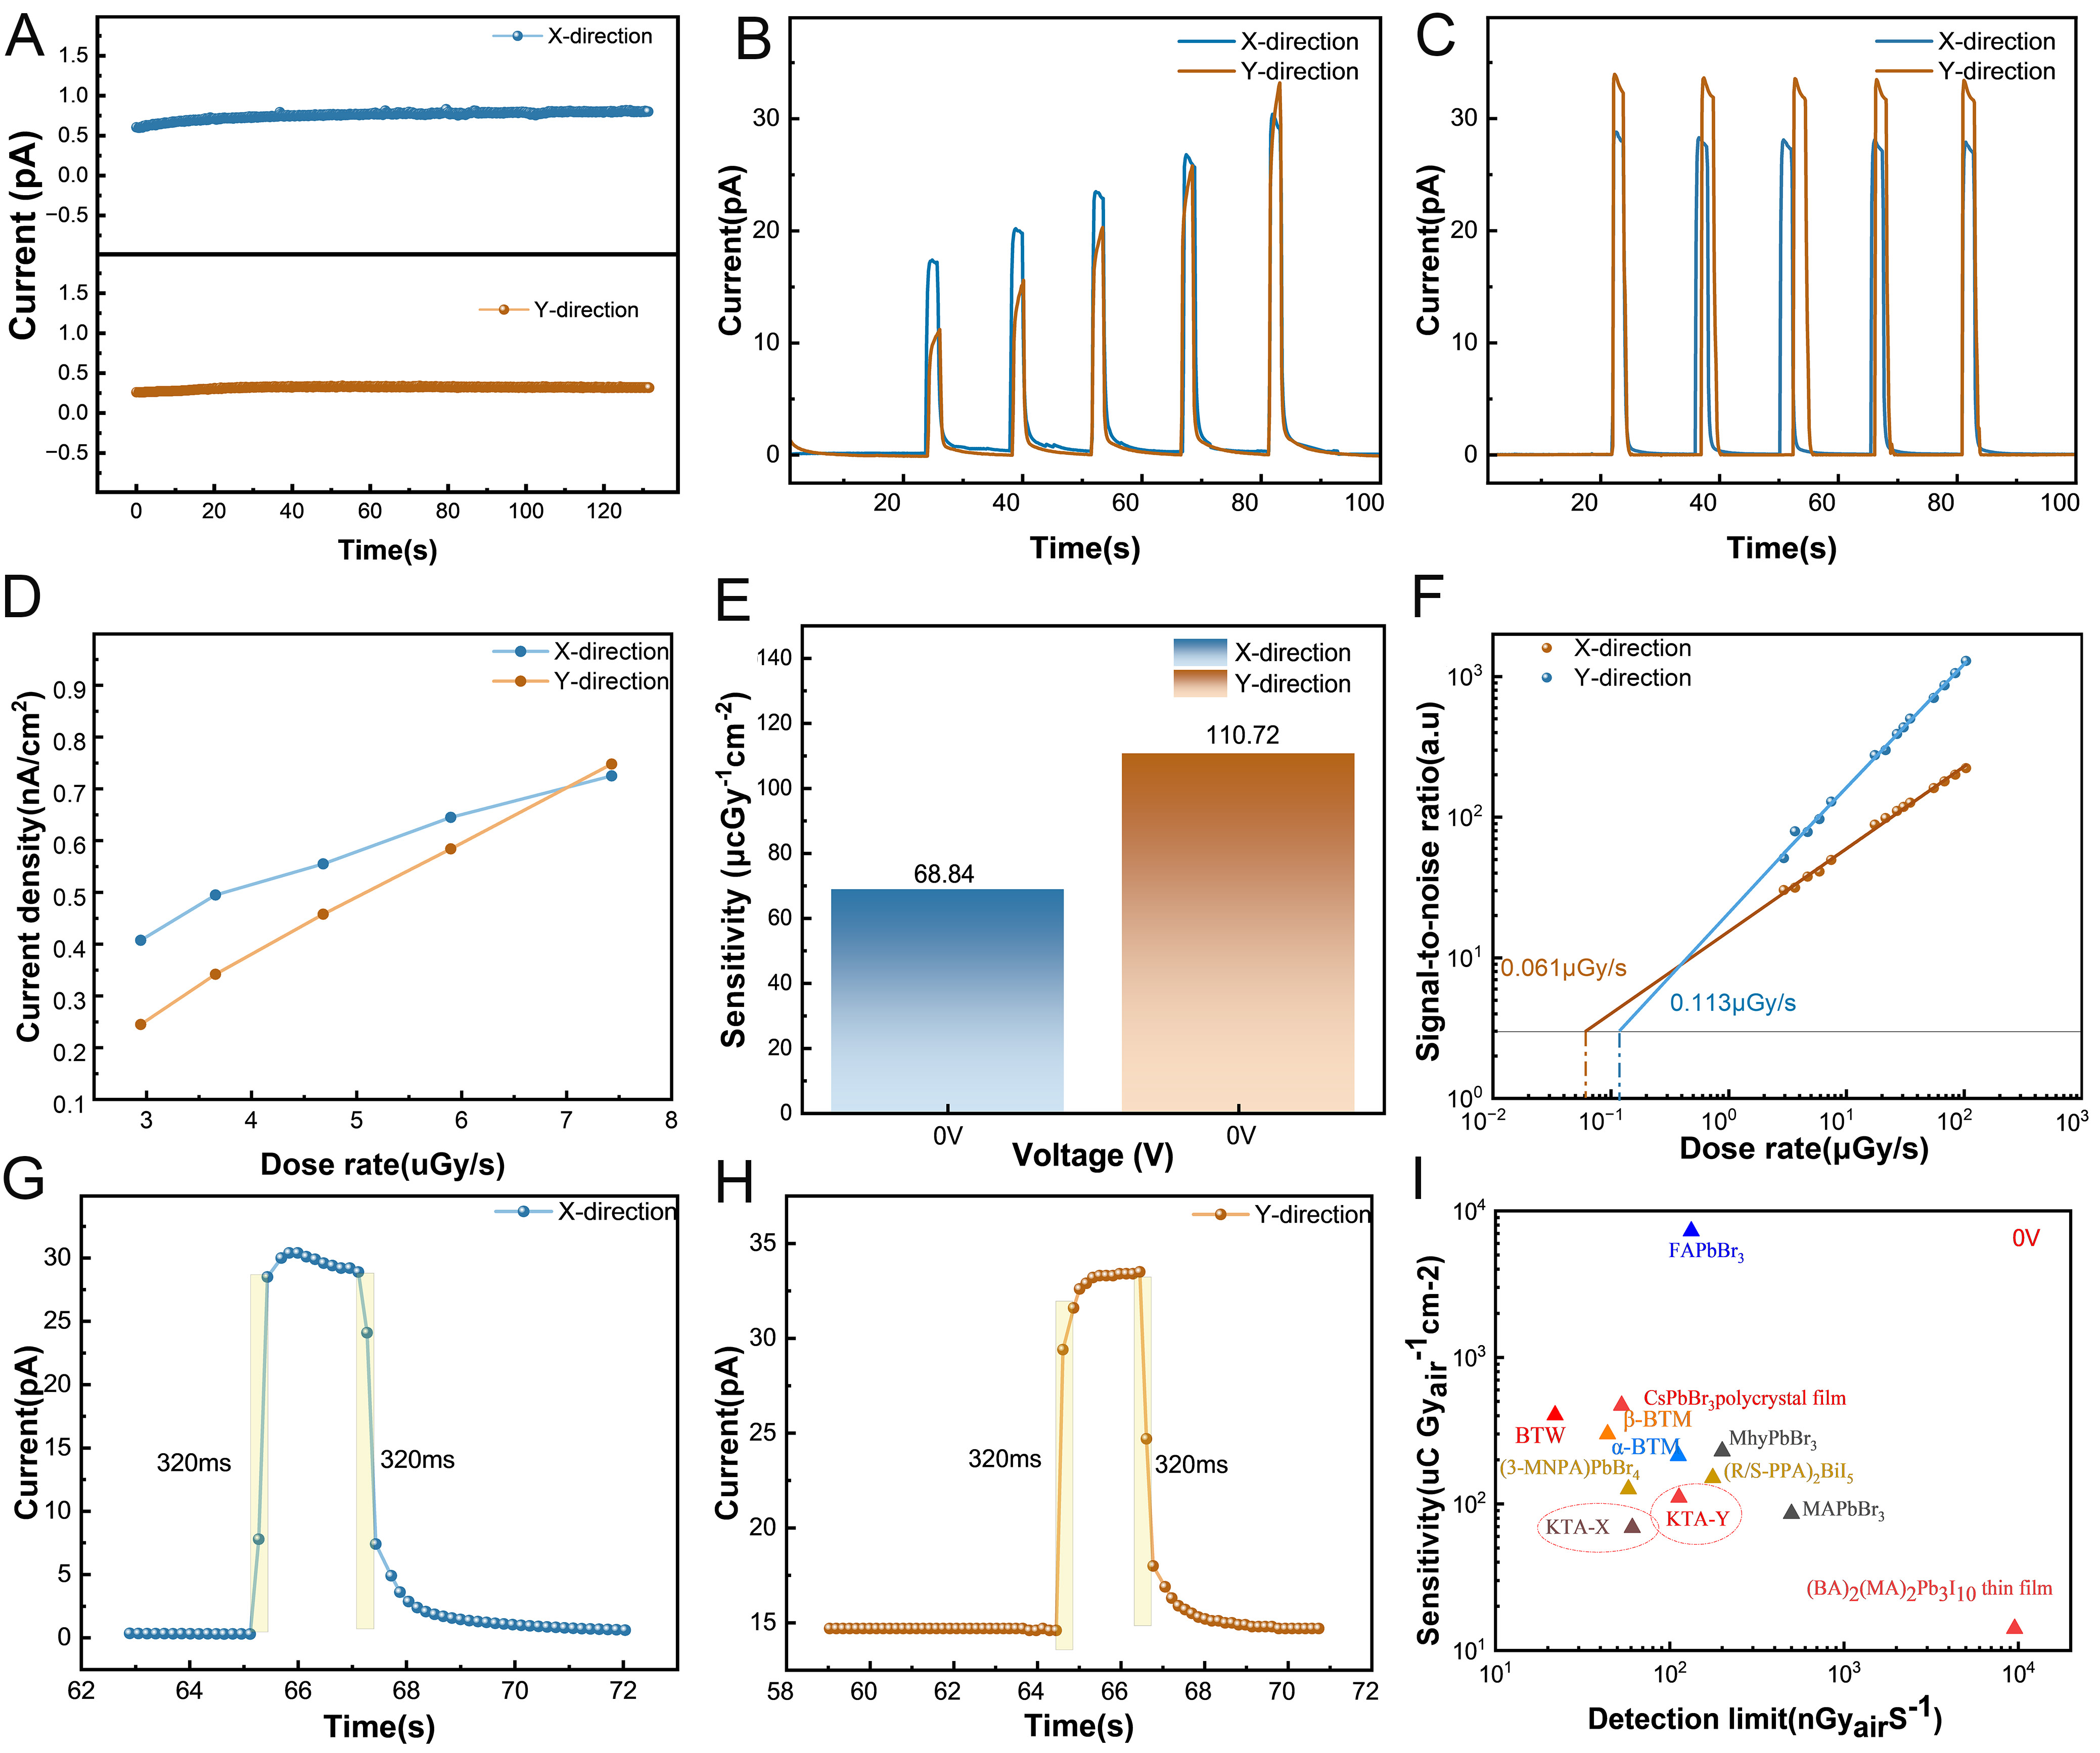
Figure 3. (A) Dark current of the KTA detector at 0 V bias. (B) Photocurrent response of the KTA detector at 0 V bias. (C) Steady-state photocurrent signal of the KTA detector under continuous X-ray irradiation. (D) Photocurrent density without applied bias. (E) Sensitivity without applied bias. (F) Detection limit without an applied bias. (G and H) Response time of the detector without an applied bias. (I) Comparison of detection performance without an applied bias[20,25,26,43-49].