


Hollow Ni0.5Zn0.5Fe2O4/C/Ni microspheres with excellent microwave absorption properties
 0
0 Abstract
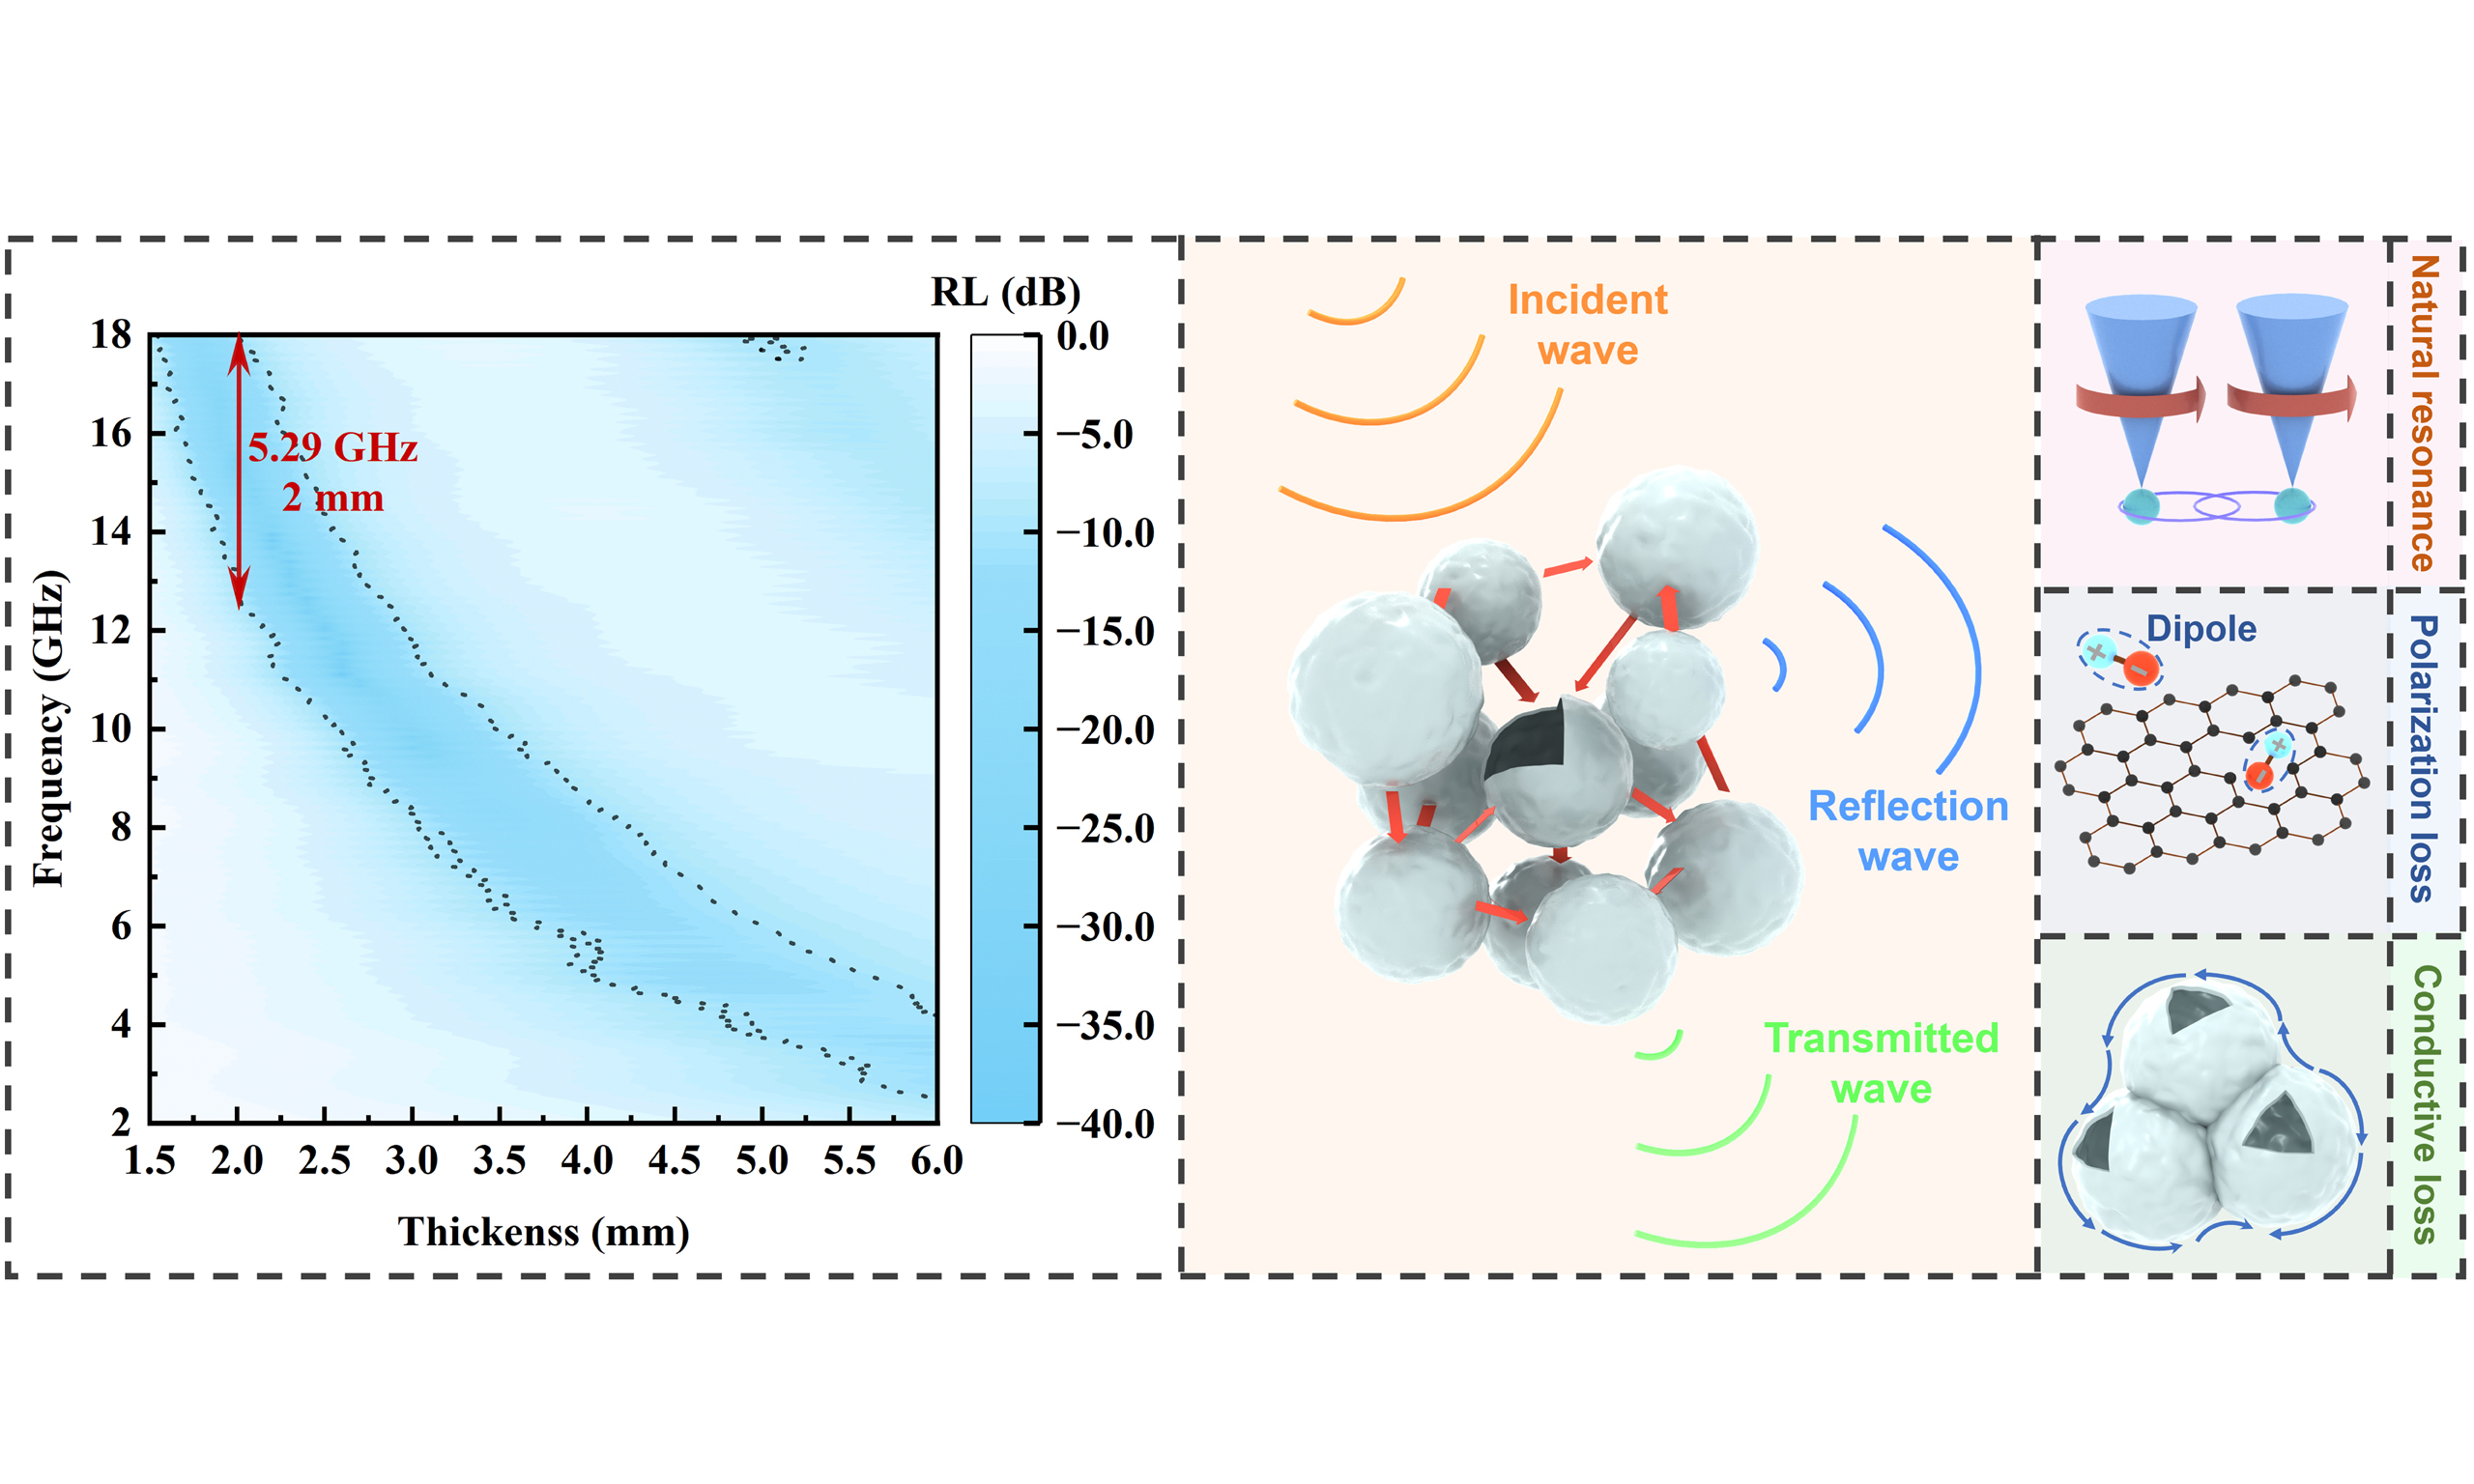
The development of highly efficient microwave absorbers presents a significant challenge, driven by the growing issue of severe electromagnetic pollution. In this context, precise structural design emerges as a decisive factor for enhancing the microwave absorption capabilities. In this work, the hollow Ni0.5Zn0.5Fe2O4/C/Ni microspheres were fabricated through hydrothermal method, calcination treatment and further annealing. The results of the morphology observation demonstrate that the heterogeneous Ni0.5Zn0.5Fe2O4/C/Ni composites are hollow microspheres, consisting of many nanoparticles. Strikingly, the appearance of metallic Ni alongside increased carbon graphitization results from the partial reduction of Ni2+ by carbon during high-temperature annealing in the Ar atmosphere, which can be beneficial to the dielectric loss. The hollow Ni0.5Zn0.5Fe2O4/C/Ni microspheres possess outstanding microwave absorption capabilities, mainly owning to the better interface and dipole polarization, eddy current loss, conduction loss and natural resonance loss, multiply reflection and scattering between the microspheres. The hollow Ni0.5Zn0.5Fe2O4/C/Ni microspheres annealed at 700 °C exhibited an optimal reflection loss (RL) value of -35.79 dB at 2.5 mm and an effective absorption bandwidth (EAB) of 5.29 GHz at 2.0 mm. The present study reveals a design approach for heterostructures, which offers novel insights into the fabrication of high-performance microwave absorbing materials.
Keywords
INTRODUCTION
The remarkable advancements in electronic technology have undoubtedly brought about a significant degree of convenience for human beings. However, it is important to acknowledge the concomitant problems that have arisen, including but not limited to electromagnetic interference and radiation pollution[1-3]. In order to solve these critical issues, considerable efforts have been made to develop microwave absorption materials that exhibit a broad absorption bandwidth, a thin structure, a high degree of absorption, and a low weight[4-6]. Based on the electromagnetic wave (EMW) loss mechanism, EMW absorption materials can be categorized into two main types: dielectric loss-type and magnetic loss-type materials[7-10].Among many promising materials, ferrites, especially the spinel ferrites, exhibit excellent electromagnetic properties, including high saturation magnetization, high magnetic crystal anisotropy, high Curie temperature and reliable chemical stability[11-13]. However, the ferrite-based absorbers usually present a high filling ratio and a heavy coating, which greatly limits their military and practical application[13-15]. Fortunately, this issue can be efficiently addressed through the combination of ferrites and low-density materials with excellent dielectric properties[16,17]. For example, Tang et al.[18] reported the development of a zinc ferrite/multi-walled carbon nanotubes (MWCNTs) composite using a combined co-hydrothermal and sol-gel approach, with an optimal reflection loss (RL) of -40.65 dB achieved at 0.81 GHz. Zong et al.[19] reported a maximum RL of -47.8 dB at 10.7 GHz for their reduced graphene oxide-Ni0.5Zn0.5Fe2O4 composite, which was produced via a simple approach. Zhou et al.[20] fabricated carbon nanotube/Ni0.5Zn0.5Fe2O4 composite by a combined precipitation-hydrothermal method, exhibiting a strong RL value of -32.5 dB at 3.9 GHz.
Furthermore, another determinant for adjusting EMW absorption performance lies in the morphology and structural design of the materials themselves. Extensive research has confirmed that hollow structures not only alleviate the weight of ferrite-based coatings, but also enhance their electromagnetic performance[21-23]. It is feasible to summarize the advantages of hollow ferrite structures as: (i) enhanced impedance matching, (ii) reduced the filling ratio to achieve material lightweighting, and (iii) reinforced interfacial polarization[24]. For instance, Sui et al.[25] fabricated hollow Fe3O4 particles by solvothermal method, which exhibited the effective absorption bandwidth (EAB) of 4.72 GHz at 2.49 mm. Moreover, the RL of -55.14 dB was attained at a matching thickness of 2.07 mm. Mandal et al.[26] prepared NiFe2O4 nano-hollow spheres via a solvothermal process, which demonstrated an EAB of 2.82 GHz at a thickness of 2 mm and a strong RL of -59.2 dB at
Both the incorporation of ferrite with high dielectric materials such as nickel, zinc, and carbon, and the design of hollow structures demonstrate distinct advantages. Using these two methods in combination will maximize the microwave absorption properties of the obtained material. Thus, the Ni0.5Zn0.5Fe2O4/C hollow microspheres were prepared by self-sacrifice processing and annealing treatment. These hollow microspheres are further characterized, with their morphology, crystalline structure, and microwave electromagnetic performance being investigated as a function of annealing temperature. This Ni0.5Zn0.5Fe2O4/C hollow microsphere is a ternary composite material. Under the interfacial polarization effects between Ni-Zn ferrite, carbon, and nickel, the composite exhibits multiple loss mechanisms, delivering excellent impedance matching and absorptive properties while achieving the integration of various single-type materials. This work offers a novel strategy for preparing high-performance ferrite-based microwave absorbers.
MATERIALS AND METHODS
Materials
The fabrication of Ni0.5Zn0.5Fe2O4/C/Ni hollow microspheres involved a simple hydrothermal method and subsequent calcination. First, a homogeneous solution was prepared by dissolving 7.5 g of glucose, 1.471 g of (NH4)2Fe(SO4)2·6H2O, 0.269 g of ZnSO4·7H2O, and 0.246 g of NiSO4·6H2O in 50 mL of deionized water. The resulting homogeneous solution was diverted to a 100 mL Teflon-lined stainless steel autoclave and heated at 160 °C for 24 h to undergo a hydrothermal reaction. Upon reaching room temperature, the obtained precipitates underwent repeated washing with deionized water and subsequent drying in air at 80 °C for 6 h. Calcination of this material at 400 °C for 4 h (1 °C·min-1), and the Ni0.5Zn0.5Fe2O4/C hollow microspheres were obtained. At last, the Ni0.5Zn0.5Fe2O4/Ni/C microstructure was obtained by annealing under Ar atmosphere at 600, 700, 800 °C for 2 h. In this work, the prepared Ni0.5Zn0.5Fe2O4/C composite is designated as S1; the samples subsequently annealed at 600, 700, and 800 °C are correspondingly labeled S2, S3, and S4.
All chemical reagents were of analytical grade and used as received without further purification. Glucose (96%), (NH4)2Fe(SO4)2·6H2O (99.99%), and ZnSO4·7H2O (99.995%) were purchased from Aladdin Biochemical Technology Co., Ltd. (Shanghai, China). NiSO4·6H2O (99.9%) were purchased from Macklin Biochemical Co., Ltd. (Shanghai, China).
Characterization
A Bruker D8 Advance diffractometer (Bruker, Germany) equipped with Cu-Kα radiation (λ = 0.154 nm) was used for X-ray diffraction (XRD) analysis. The scans were recorded over a 2θ range of 5° to 90°. A Hitachi S4800 scanning electron microscopy (SEM, Hitachi, Japan) and an Field Electron and Ion (FEI) Tecnai F20 transmission electron microscope (TEM, FEI Company, USA) were used to investigate the morphological and microstructural characteristics. Raman spectra were recorded at room temperature on a Renishaw inVia Reflex spectrometer (Renishaw, UK), covering the wavenumber range from 100 cm-1 to 1,800 cm-1. The chemical states of surface metal atoms were investigated by X-ray photoelectron spectroscopy (XPS), using an Axis Ultra Delay-Line Detector (DLD) spectrometer (Kratos, UK). To measure the electromagnetic absorption properties, the composites were incorporated into paraffin wax at a mass fraction of 20% and molded into circular rings of 7 mm outer diameter with a 3.4 mm inner diameter. Measurement of both the complex permittivity and permeability for the ring-shaped samples was conducted in the 2-18 GHz band with an Agilent N5234A vector network analyzer (VNA, Keysight Technologies, USA).
RESULTS AND DISCUSSION
XRD was employed to investigate the crystal structure of each sample, with the resulting patterns presented in Figure 1A. The cubic-structured Ni0.5Zn0.5Fe2O4 (JCPDS 08-0234) is identified by the diffraction peaks marked ★. The corresponding characteristic peaks at 18.3°, 30.0°, 35.4°, 37.0°, 43.0°, 53.3°, 56.8°, 62.4°, 70.8°, and 73.8° correspond to the (111), (220), (311), (222), (400), (422), (511), (440), (620), and (533) crystal planes, respectively[28]. Meanwhile, the diffraction peaks marked ▼ are attributed to the face-centered cubic structure Ni (JCPDS 65-0308), with the characteristic peaks at 44.4°, 51.7°, and 76.2° being indexed to its (111), (200), and (220) planes, respectively[29]. The XRD diffraction spectra of S1 shows the weak diffraction peaks, indicating poor crystallinity of Ni0.5Zn0.5Fe2O4. The broad diffraction peak at 10°-20° of S1 attributed to amorphous carbon[30]. For sample S2, S3 and S4, the diffraction peaks of carbon gradually become weaker as annealing temperature increases, showing the content of carbon decreases. The characteristic peaks of the Ni0.5Zn0.5Fe2O4 become sharper, indicating the Ni0.5Zn0.5Fe2O4 is well crystallized. As the temperature increases, the diffraction peaks associated with metallic Ni grow progressively, indicating the development of higher crystallinity at elevated temperatures. During high-temperature annealing under the Ar atmosphere, metallic Ni results from the reduction of Ni2+ by carbon[31].
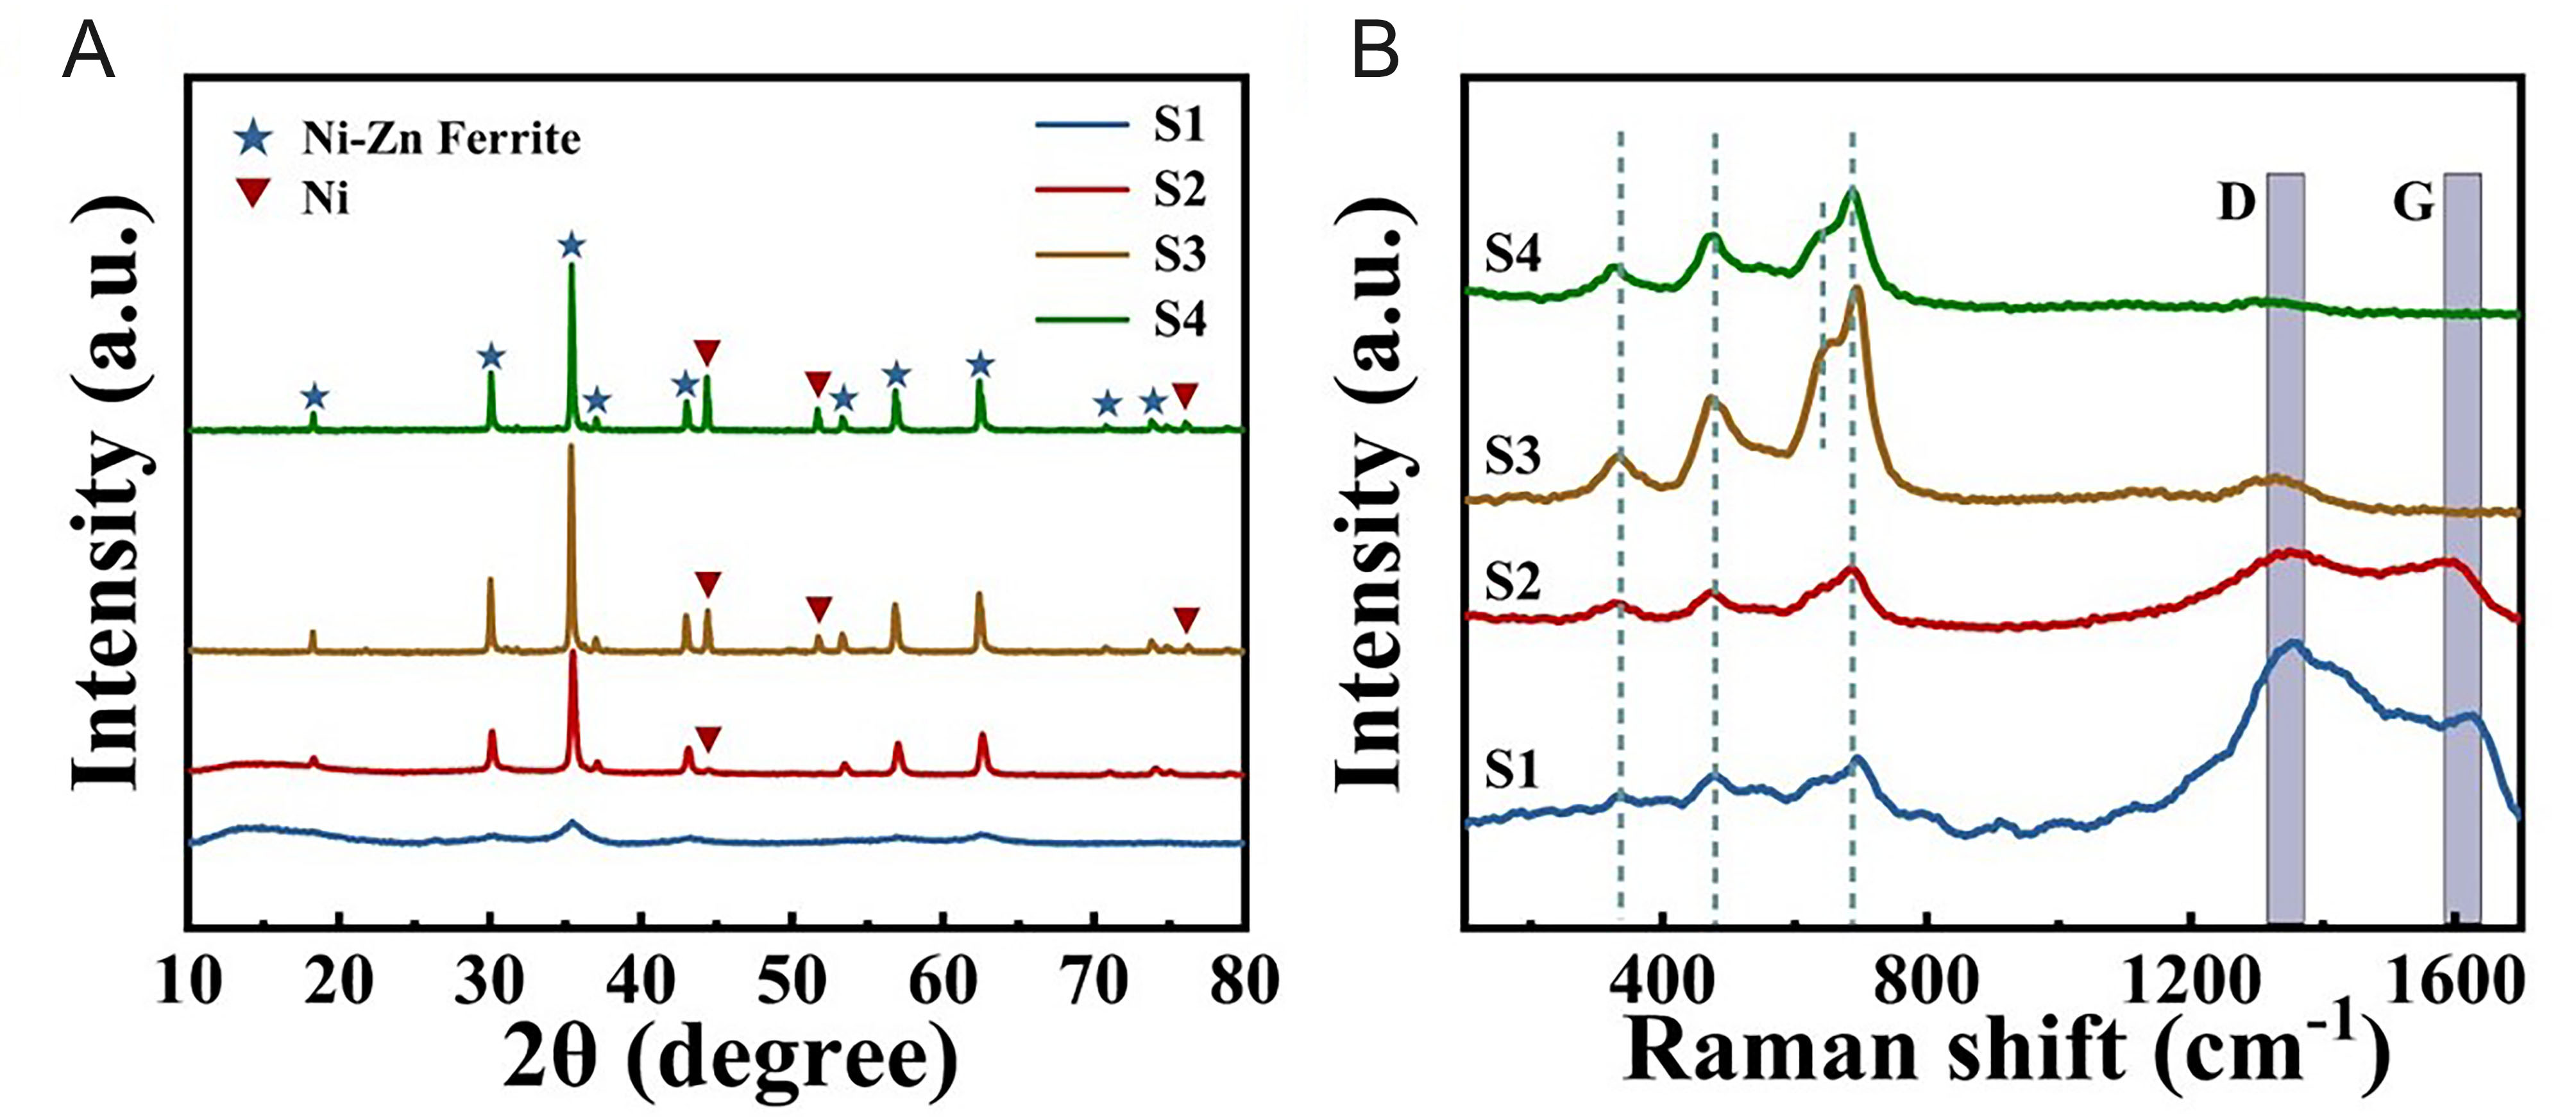
Figure 1. XRD diffraction spectra (A), Raman spectra of all samples (B).
Figure 1B shows the Raman spectra for all samples, spanning from 100 cm-1 to 1,700 cm-1. There are five major Raman active modes (A1g + Eg+ 3T2g), however, only 3 modes peaks are detected[32]. The Raman peaks located at ~330, ~470, and ~690 cm-1 assign to the Eg, T2g, and A1g modes, respectively[33]. The splitting of the A1g mode into the A1g(1) and A1g(2) branches arises from an alteration in structural symmetry, caused by the reordering of Ni2+,Zn2+ and Fe3+[34]. In addition, two prominent bands are observed: one centering on
Figure 2A-D display the SEM morphology of all samples, which consist of numerous microspheres. The presence of fractured microspheres reveals their hollow structure. The average particle diameters were determined to be 1.058 ± 0.160, 0.972 ± 0.237, 0.689 ± 0.148, and 0.561 ± 0.142 μm for S1, S2, S3, and S4, respectively. These size distributions are illustrated in Figure 3. As the temperature rises, the hollow microspheres undergo volumetric contraction. This shrinkage is primarily due to the densification of adsorbed metal ions into oxides and the further carbonization of organic matter during heat treatment[37].
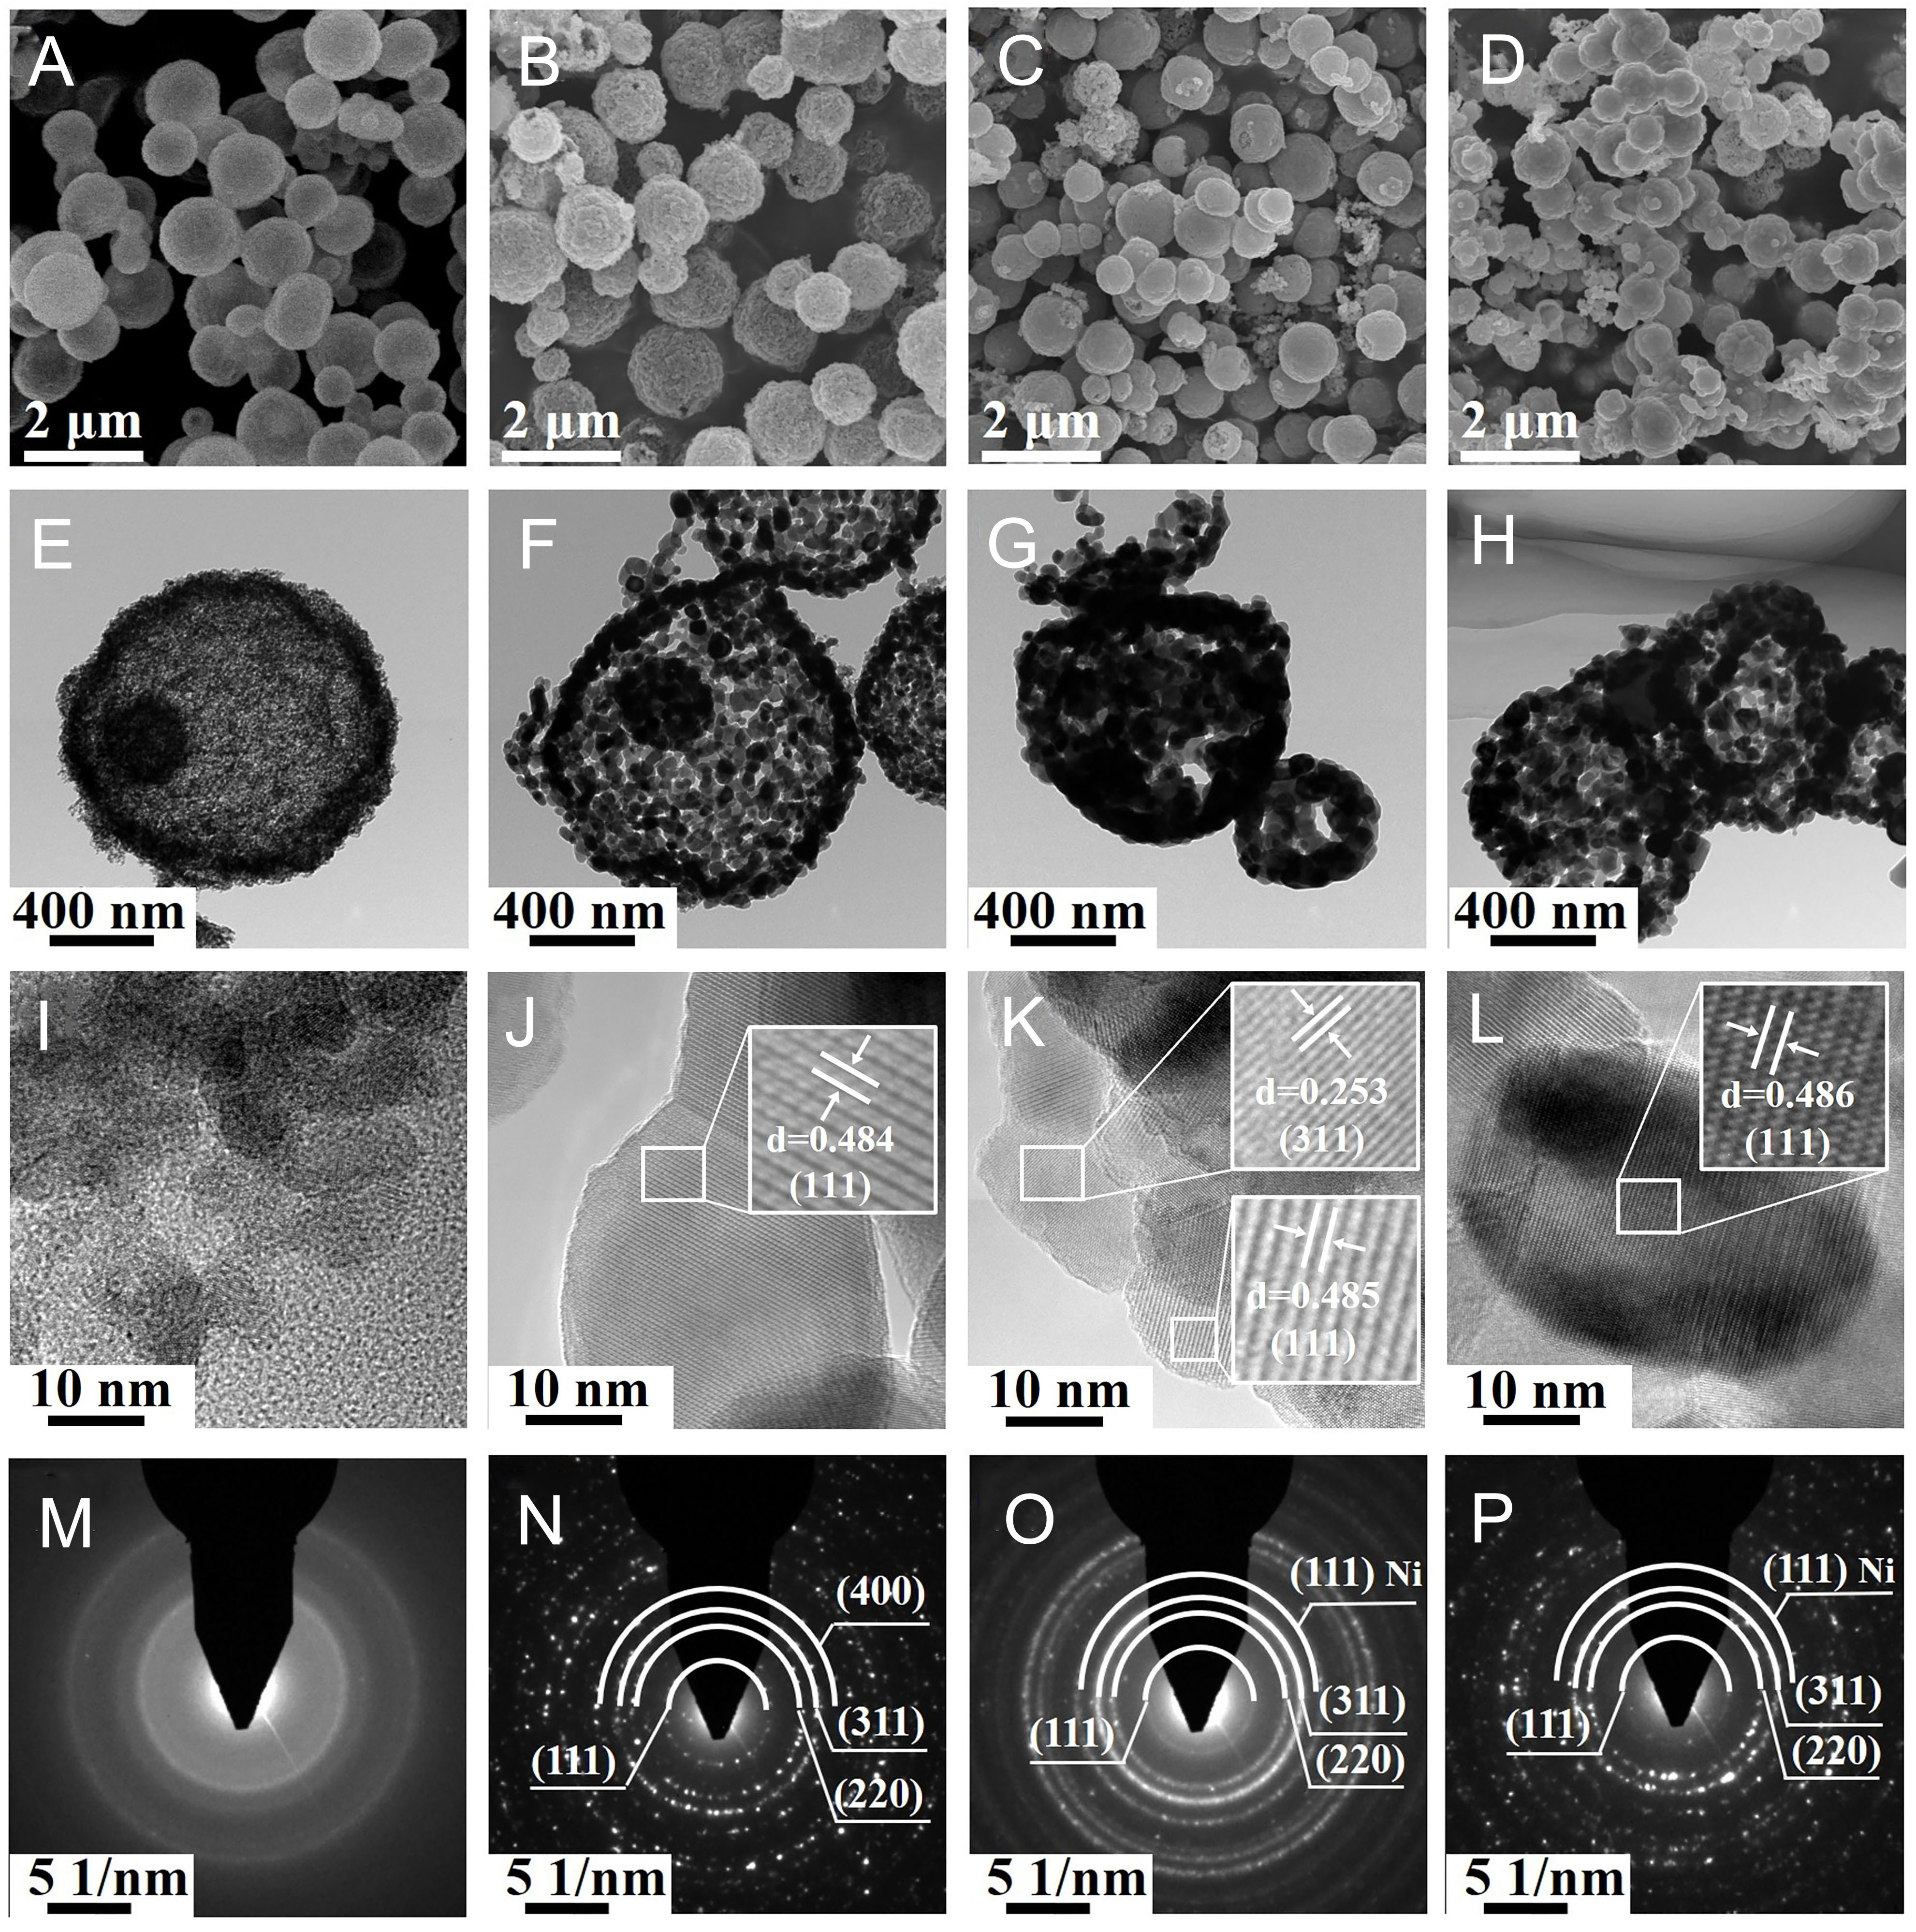
Figure 2. SEM images of S1 (A), S2 (B), S3 (C), S4 (D). TEM images of S1 (E), S2 (F),
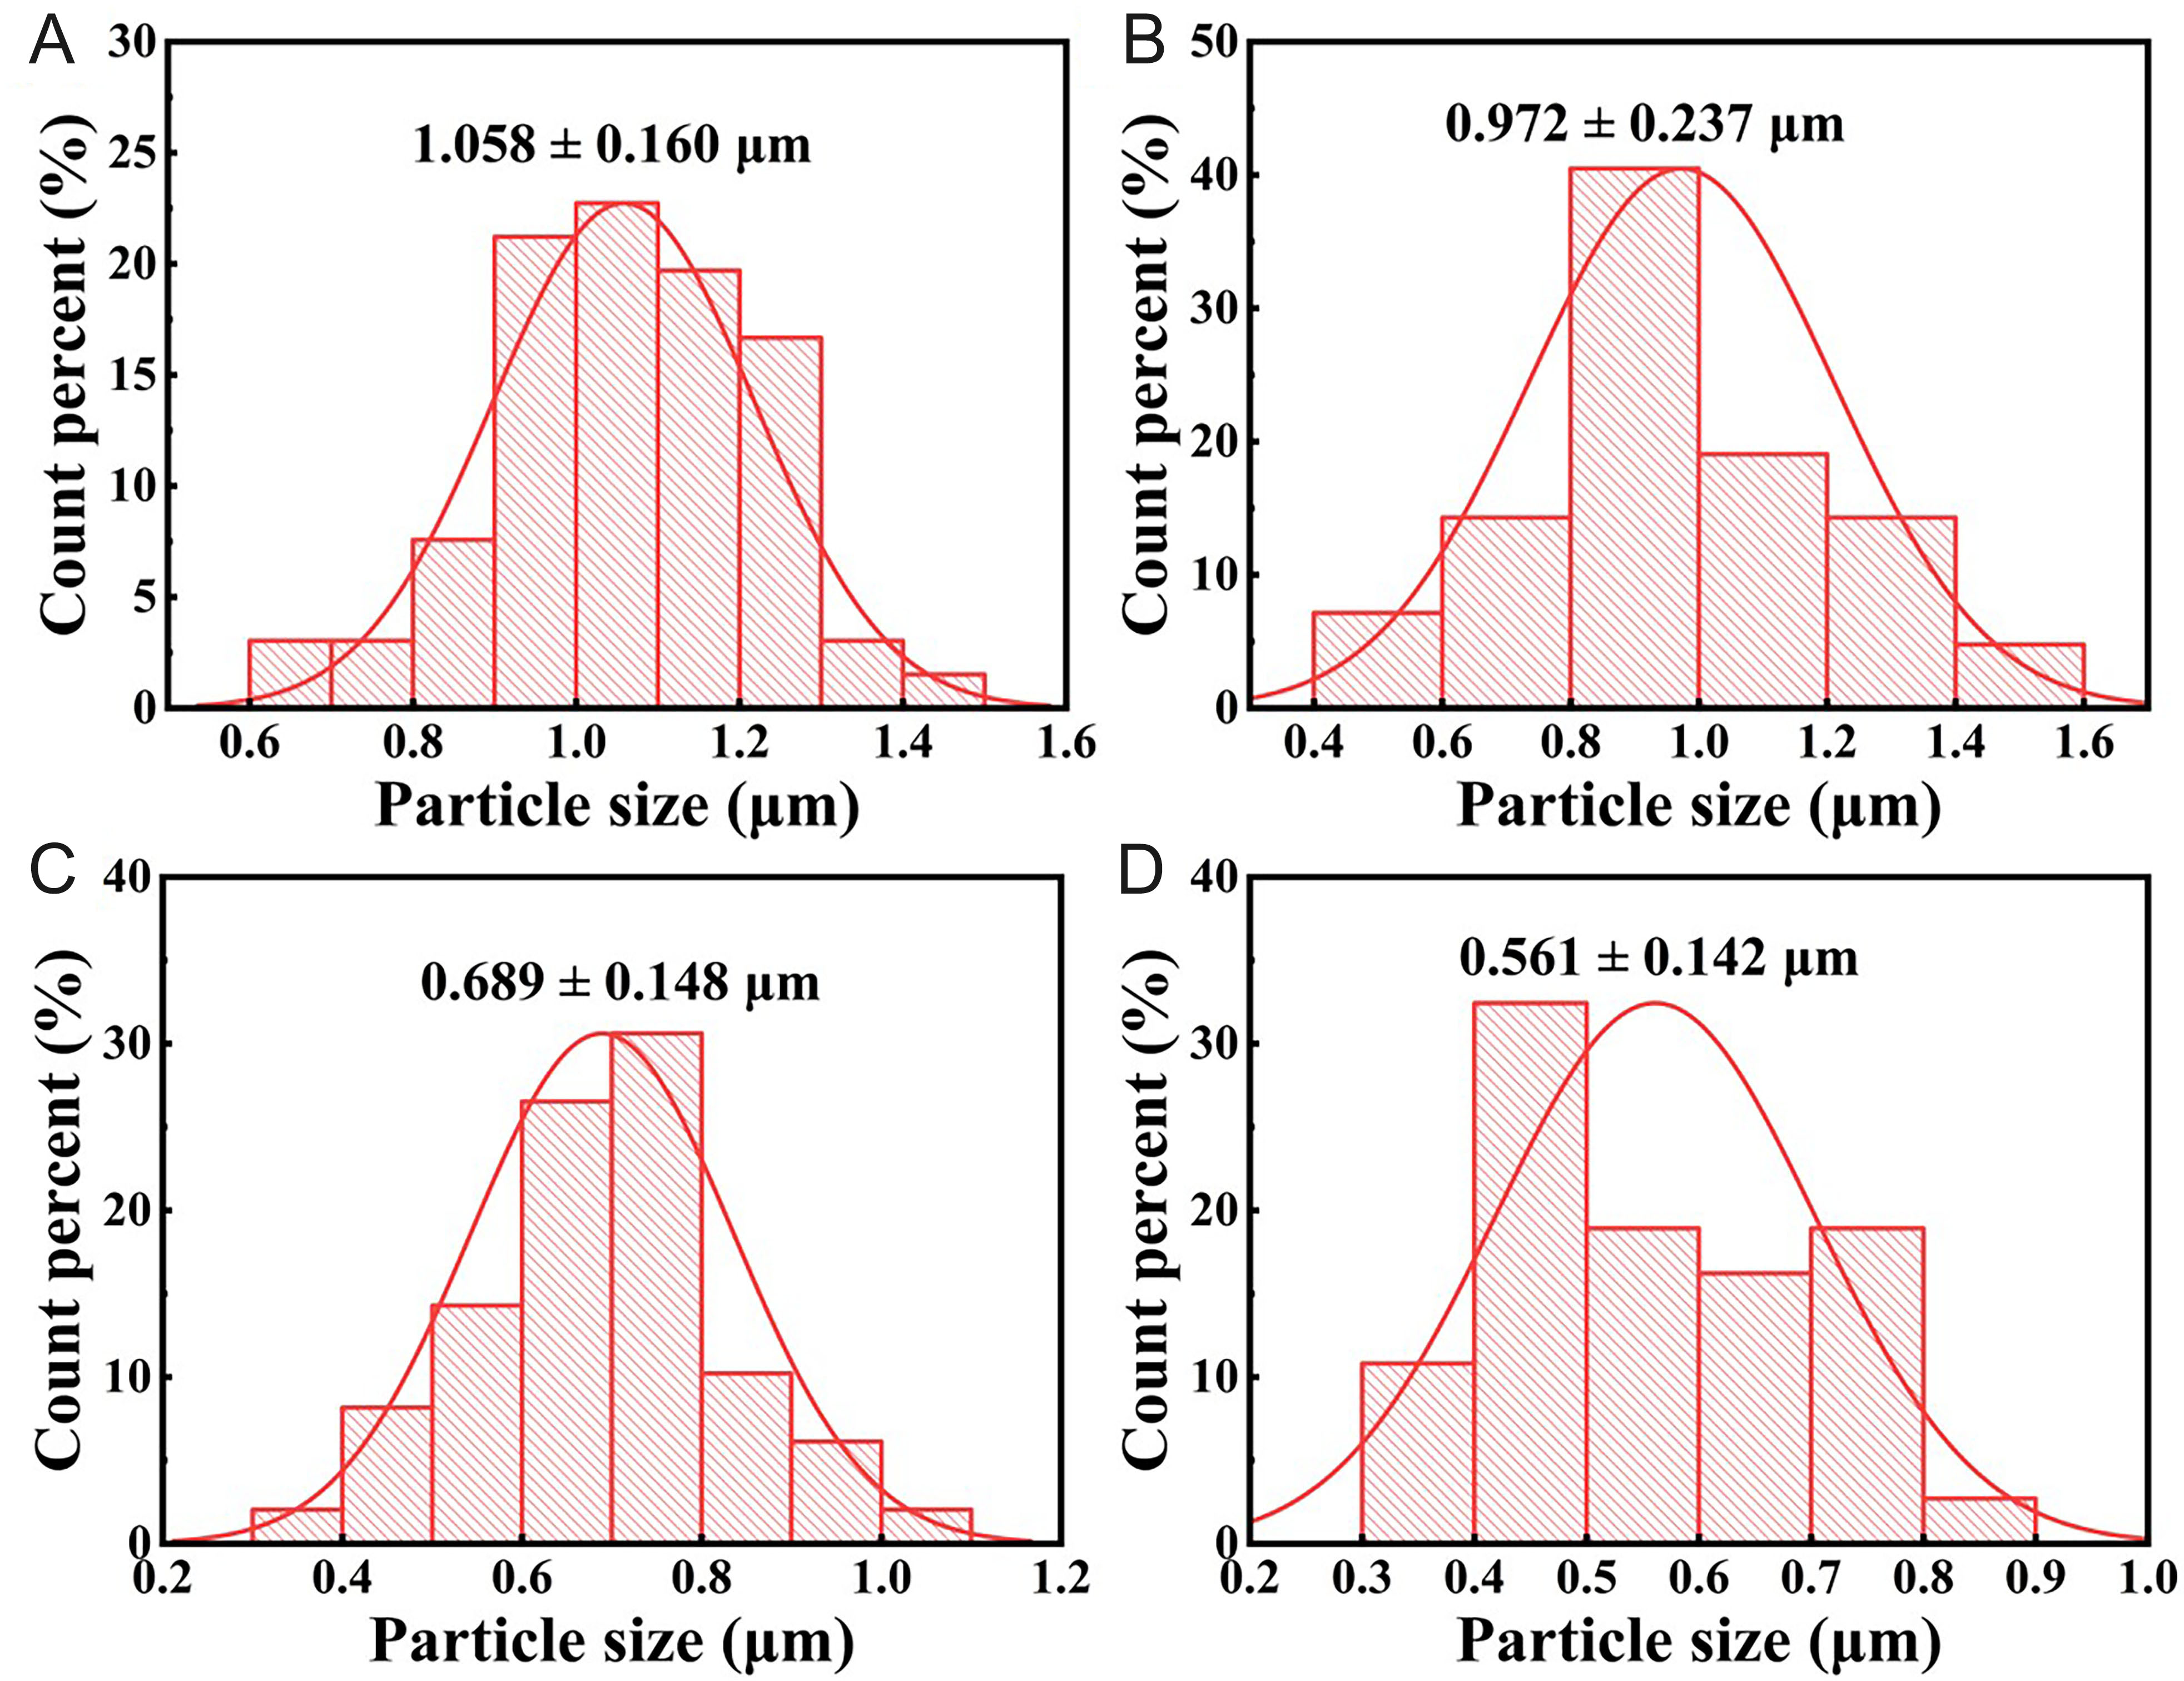
Figure 3. Particles size distribution of S1 (A), S2 (B), S3 (C) and S4 (D).
The TEM, high-resolution transmission electron microscopy (HRTEM) and selected area electron diffraction (SAED) are investigated to understand the morphology of samples. TEM micrographs in Figure 2E-H show that these microspheres possess a hollow structure constructed from numerous nanoparticles. The HRTEM images Figure 2I-L reveal no discernible lattice fringes in sample S1, confirming its poor crystallinity. The observed lattice fringes in samples S2, S3, and S4 correspond to the (111) crystallographic plane of Ni0.5Zn0.5Fe2O4, with interplanar distances measured as 0.484, 0.485, and 0.486 nm, respectively. Additionally, a lattice fringe of 0.253 nm is observed in sample S3, which corresponds to the (311) plane of Ni0.5Zn0.5Fe2O4. As displayed in Figure 2M-P, the SAED pattern of S1 shows no obvious diffraction rings. And the SAED pattern of S2 exhibiting sharp and discrete rings can be matched with the (111), (220), (311) and (400)
Elemental mapping of samples S1-S4 [Figure 4] serves to examine the effect of annealing temperature on the composition distribution of Fe, Ni, Zn, O, and C. The red flaky areas belong to the substrate used in the TEM preparation process rather than the sample. As shown, the Zn, Fe, O, and C elements exhibit a homogeneous distribution on the microsphere surfaces. As the annealing temperature rises, the distribution of element C decreases, corresponding to a lower surface carbon content. In contrast, Ni tends to aggregate towards the particle surface, especially in sample S4. This illustrates the partial carbothermal reduction of Ni0.5Zn0.5Fe2O4 to metallic Ni by amorphous carbon.
Figure 4. Elemental mapping images of S1 (A), S2 (B), S3 (C), S4 (D).
The elemental composition and chemical states of samples S1-S4 are analyzed by XPS. Figure 5 shows
Figure 5. XPS spectra of Ni 2p of S1 (A), S2 (B), S3 (C), S4 (D). XPS: X-ray photoelectron spectroscopy.
Figure 6. XPS spectra of C 1s of S1 (A), S2 (B), S3 (C), S4 (D). XPS: X-ray photoelectron spectroscopy.
Figure 7. XPS spectra of Fe 2p of S1 (A), S2 (B), S3 (C), S4 (D). XPS: X-ray photoelectron spectroscopy.
The complex permittivity (εr = ε’ - jε”) and dielectric loss tangent of the samples are presented in Figure 8A-C, whereas their complex permeability (μr = μ’ - jμ”) and magnetic loss tangent are shown in Figure 8D-F. The energy storage capacity within a material is respectively represented by the real parts of its complex permittivity (ε’) for electric energy and permeability (μ’) for magnetic energy. Conversely, the dissipation of electric and magnetic energy is respectively reflected in the imaginary parts ε’’ and μ’’[42]. Notably, for sample S1, both the permittivity and permeability are not only the lowest but also show minimal variation across the frequency range, pointing to a limited dielectric loss capability. A clear upward trend in both ε’ and ε’’ is observed for samples S2, S3, and S4. The reasons for this enhancement in complex permittivity are as follows: (1) During the formation of Ni0.5Zn0.5Fe2O4/C hollow microspheres at high temperature, the enhanced crystallization of carbon facilitates the generation of polar bonds and polarization charges, leading to the increase in electrical conductivity (δ)[43]. As dictated by the classical free electron theory (ε” = δ ⁄ 2πε0f), the value of ε’’ scales linearly with the electrical conductivity (δ)[24]. (2) The appearance of metallic Ni can lead to the increase of complex permittivity[44]. Therefore, as the annealing temperature rises and the metallic Ni content correspondingly increases, sample S4 achieves the largest dielectric imaginary part. This value is nearly double that observed in S2 and S3. In addition, as indicated by the preceding XRD results and Raman spectra, the graphitization degree of S2 has increased while the carbon content of S3 has decreased. Consequently, the ε’ and ε’’ values of S2 have risen, whereas the reduction in carbon content for S3 has led to a decrease in its ε’ and ε’’ values. Overall, the variation in permittivity results from the combined effects of metallic Ni content, carbon content, and carbon crystallinity/graphitization degree. As frequency increases, the μ’ values of samples S2-S4 exhibit a decrease within the 2-8 GHz band before gradually converging toward 1, while those of S1 remain around 1 with only minor fluctuations, as depicted in Figure 8D. The values of μ’’ decrease significantly during 2-14 GHz and basically stay 0 at 14-18 GHz for S2-S4. The decline in permeability is primarily governed by the Snoek limit, which posits that the product of permeability and cut-off frequency is approximately constant. This relationship is formally described by the following equation[45]:
Figure 8. (A) Real parts of complex permittivity, (B) imaginary parts of complex permittivity, (C) dielectric loss tangents, (D) real parts of complex permeability, (E) imaginary parts of complex permeability, and (F) magnetic loss tangents of S1, S2, S3 and S4, respectively.
Here μ’ denotes the initial permeability, fc represents the cut-off frequency, γ stands for the gyromagnetic ratio, and Ms signifies the saturation magnetization. As inferred from Equation (1), a higher permeability of the material corresponds to a lower cut-off frequency. Ni is a ferromagnetic material with a Ms higher than that of ferrite. Consequently, the incorporation of metallic Ni not only enhances the permeability of the sample but also elevates its cut-off frequency relative to ferrite. For this reason, while permeability decreases sharply in the high-frequency regime, the introduction of metallic Ni slightly shifts the cut-off frequency toward higher frequencies, which mitigates the rapid attenuation of permeability to a certain extent. This observation aligns with the results presented in Figure 8E.
To elucidate the microwave absorption mechanism, the dielectric (tanδε = ε’’/ε’) and magnetic (tanδμ = μ’’/μ’) loss tangents of the samples were analyzed. As presented in Figure 8C, the tanδε of S4 surpasses that of all other samples, indicating its strongest dielectric loss. Concurrently, the tanδε for all samples exhibits fluctuations with increasing frequency. Regarding the characteristics of magnetic loss, as shown in Figure 8F, the S4 sample exhibits the highest tanδμ value among samples S1-S4. A direct comparison between tanδμ and tanδε shows that within the 2-8 GHz range, tanδμ exceeds tanδε, while from 8 GHz to 18 GHz, tanδε is higher than tanδμ. This comparison indicates that magnetic loss dominates in the lower frequency band (2-8 GHz), whereas dielectric loss prevails in the higher frequency band (8-18 GHz).
In absorbing materials, the relaxation during polarization process is the primary source of dielectric loss. This process comprises multiple mechanisms: interfacial polarization, dipole orientation polarization, ionic polarization, and electron polarization[27]. Since ion and electron polarization are effective within the
Here, ε∞ and εs denote the relative permittivity and static permittivity, respectively. In generally, a Debye relaxation process is indicated by each semicircle observed in the Cole-Cole plot (ε’ - ε’’).
Figure 9A-D show the ε’ - ε’’ plots of samples S1, S2, S3 and S4, it is clear that Cole-Cole curves of S2, S3 and S4 consists of semicircles and straight tails. Such straight tails in S2, S3 and S4 are regarded as the evidence of the contribution of conduction loss, which is mainly brought out by the carbon[47]. It is well established that interfacial polarization significantly contributes to EMW relaxation losses in composite materials, as supported by experimental and computational studies[48]. EMW radiation exposure of the composite surface induces the formation of interfacial space charge regions and local electric fields, thereby giving rise to free charge accumulation[24]. The free electron theory indicates that the emergence of relaxation peaks arises from the abnormal increase in local resistance. Furthermore, structural imperfections such as broken holes or cracks introduce edge effects, promoting the formation of additional dipoles[49]. Therefore, it can be inferred that conductive loss and interfacial polarization loss predominantly govern EMW dissipation in this case.
Figure 9. Cole-Cole semicircle curves of S1 (A), S2 (B), S3 (C), S4 (D).
To further quantify the relative contributions of conduction loss and polarization loss, Debye relaxation fitting was performed on all samples. According to Debye theory, the total dielectric loss can be expressed as the sum of the conduction loss (ε”c) and the polarization loss (ε”p)[50]. Figure 10A and B display the frequency-dependent curves of ε”c and ε”p for the four samples over the 2-18 GHz range. The results indicate that both the conduction loss and polarization loss increase with rising annealing temperature. The enhancement in conduction loss is mainly attributed to the increase in metallic Ni content, which raises the electrical conductivity of the material. Additionally, as noted earlier, the carbon content of sample S3 is lower than that of S2, thus leading to a slight decrease in the conduction loss of S3. The growth in polarization loss primarily originates from the increased interfaces between metallic Ni and the ferrite, which strengthens the interfacial polarization effect.
Figure 10. The separated ε”c (A) and ε”p (B) of S1, S2, S3, and S4 within the frequency range of 2-18 GHz.
Magnetic losses are mainly attributed to hysteresis and eddy current effects, along with the multiple resonance mechanisms (including exchange, domain wall, and natural resonance)[51]. Given their predominant occurrence at lower frequencies (MHz), domain wall resonance loss and hysteresis loss are negligible in this context. The eddy current loss is given by[52]:
Here, σ and μ0 are respectively the electrical conductivity and the vacuum permeability, while C0 (ns) represents the eddy current coefficient. If the RL arises exclusively from eddy currents, then the C0 values will exhibit no variation across the frequency spectrum. The C0 values of all samples are presented in Figure 11A, the attenuation constant (α) is shown in Figure 11B, and the |Zin/Z0| values are displayed individually in Figure 11C-F. Notably, the C0 values of the S2, S3, and S4 show minimal variation across the 14-18 GHz frequencies, suggesting that eddy current losses dominate the magnetic loss within this spectrum. Meanwhile, across the 2-14 GHz range, magnetic loss is significantly reduced and is primarily characterized by exchange and natural resonance effects.
Figure 11. The values of C0 (A) and attenuation constant α (B) of all samples, impedance matching conditions of S1 (C), S2 (D), S3 (E),
For the quantitative evaluation and comparison of absorber performance, the RL is calculated using transmission line theory, with the relevant equations given below[53]:
Here, Zin and Z0 are the input impedance of the EMW absorbing materials and the impedance of free space, respectively; εr and μr represent the relative complex permittivity and permeability; c, f, and d correspond to the speed of light in the vacuum, the frequency of the EMW, and the absorber thickness.
In general, the RL value below -10 dB is defined as indicating effective EMW absorption, corresponding to an EMW absorption rate exceeding 90%. This is commonly used as the criterion for determining effective EMW absorption. Figure 12 depicts the RL curves for samples S1 through S4 across a thickness range of
Figure 12. Frequency dependence of RL, matching thickness curves under λ/4 conditions of S1 (A), S2 (B), S3 (C), S4 (D). RL: Reflection loss.
The RL peaks exhibited a consistent shift to lower frequencies with greater thickness. This trend is attributed to the quarter-wavelength model[54]:
Here, tm, fm, λ, and c represent the matching thickness, matching frequency, wavelength, and the speed of light in vacuum, respectively. Figure 12 plots the tm against the dm for samples S1-S4 at the λ/4 and 3λ/4 wavelengths. The peak layer thickness for all samples matches well with the quarter wavelength, confirming that the quarter-wavelength cancellation model governs the microwave absorption mechanism.
The microwave absorption properties of materials are primarily determined by two key factors: impedance matching and electromagnetic attenuation. The impedance matching |Zin/Z0|, calculated using Equation (5) above, reflects the efficiency with which incident EMW enter the absorber and are subsequently converted into thermal energy[55]. The |Zin/Z0| value close to 1 is a direct indicator of optimal impedance matching, thereby allowing a greater proportion of incident EMW to enter the material. In addition, good impedance matching enables the material to minimize the reflection of EMW at its surface. In Figure 11C-F, the |Zin/Z0| curves for S2 and S3 approach 1, indicating well-matched impedance. However, since the |Zin/Z0| values for S1 and S4 deviate from 1, the majority of the incident EMW undergoes reflection at the surface. Thus, S1 and S4 have poor absorption performance.
The α can be estimated by the following formula[56]:
As shown in Figure 11B, α values of all samples show an increasing tendency as frequency varies. The α values follow the sequence S4 > S2 > S3 > S1. This order aligns with that of the tangent dielectric loss, underscoring the crucial role of dielectric loss[24]. The highest α value observed in S4 can be attributed to its higher ε’’ and μ’’ values. However, as the annealing temperature increases, the content of metallic Ni gradually increases, leading to an increase in material conductivity, enhanced surface reflection, and prevention of electromagnetic wave entry, resulting in deterioration of the impedance matching of S4. Therefore, based on the preceding impedance matching analysis, S3 is identified as the most promising absorbent candidate.
In addition, the Ni0.5Zn0.5Fe2O4/C/Ni microspheres, based on a hollow structure, can achieve excellent microwave absorption performance at low filling ratios, demonstrating the advantage of lightweight. Table 1 compares the filling ratios and microwave absorption performance of other ferrite-based materials.
Microwave absorption properties and filling ratio of Ni0.5Zn0.5Fe2O4/C/Ni and other ferrite-based materials
| Materials | RLmin (dB) | EAB (GHz) | Thickness (mm) | wt. (%) | Ref. |
| Zn0.35Ni0.65Fe2O4/Ni-Cu | -35 | 4.7 | 2 | 80 | [57] |
| NiFe2O4/CF | -20.46 | 3.98 | 2.55 | 20 | [58] |
| PNBC/CoFe2/CoFe2O4 | -52.21 | 4.32 | 1.44 | 30 | [59] |
| Mn0.8Zn0.2Fe2O4/EMG4 | -60 (1.77 mm) | 4.56 | 1.47 | 70 | [60] |
| Fe3O4@C | -53.7 (1.7 mm) | 5.26 | 1.9 | 40 | [61] |
| Ni0.5Zn0.5Fe2O4/C/Ni | -35.79 (2.5 mm) | 5.29 | 2 | 20 | This work |
The analysis shows that as the annealing temperature increases, the crystallinity of carbon in the samples is progressively enhanced, which in turn leads to improved electrical conductivity. Simultaneously, Ni elements progressively aggregate to form metallic particles. Consequently, when the annealing temperature reaches 800 °C, the content of metallic Ni reaches its peak, resulting in the highest dielectric loss for the S4 sample. However, this also compromises its impedance matching performance. In contrast, the S3 sample, benefiting from an optimal annealing temperature, achieves better control over carbonization degree and metallic Ni content. This results in a well-balanced dielectric loss capability and impedance matching performance, yielding a satisfactory attenuation constant. The mechanism of EMW loss in Ni0.5Zn0.5Fe2O4/C/Ni hollow microspheres primarily stems from the following factors. First, through the synergistic effect of controlling the metallic Ni content via annealing temperature and the hollow structure within the microspheres, Ni0.5Zn0.5Fe2O4/C/Ni hollow microspheres achieve excellent impedance matching. Second, the hollow architecture effectively reduces the sample weight, enabling the composite to achieve excellent microwave absorption at a low filling ratio, which is beneficial for lightweighting and broadens the application scope. Meanwhile, the hollow structure creates heterogeneous interfaces with air, thereby enhancing interfacial polarization. Structural defects such as fractured pores and cracks serve as additional dipole centers, giving rise to dipole polarization loss. Furthermore, conductive loss primarily attributed to carbon and natural resonance induced by the ferrite are also significant contributors. These characteristics collectively contribute to the realization of broadband absorption performance.
CONCLUSION
In summary, Ni0.5Zn0.5Fe2O4/C hollow microspheres were successfully fabricated through a simple two-stage method of hydrothermal and calcination. The study reveals that Ni0.5Zn0.5Fe2O4/C hollow microspheres annealed at 700 °C exhibit superior microwave absorption. The optimal performance includes an RL value of -35.79 dB at 2.5 mm, while with a thinner layer of 2.0 mm, it offers an EAB reaching 5.29 GHz. The excellent broadband absorption arises from the synergistic combination of interfacial polarization, dipole polarization, conduction loss, and natural resonance, facilitated by the hollow architecture, the graphitized carbon, and the formed metallic Ni. This research offers novel inspiration and perspectives for enhancing the performance of ferrite absorbers.
DECLARATIONS
Authors’ contributions
Writing-original draft, writing-review & editing, conceptualization, data analysis: Zhou, D.; Wang, A.
Writing-review & editing, data analysis, funding acquisition: Gao, Y.
Data analysis & curation: Zhou, D.; Li, C.
Collecting literature, investigation, conceptualization: Shi, R.; Wu, Q.
Conceptualization, writing-review, funding acquisition: Man, Q.; Shen, B.
Availability of data and materials
The data presented in this study are available on request from the corresponding author due to privacy.
AI and AI-assisted tools statement
Not applicable.
Financial support and sponsorship
This work was supported by National Natural Science Foundation of China (Grant 62501580), Natural Science Foundation of Zhejiang Province (Grant LQN26F010009), and Natural Science Foundation of Ningbo [Grant 2024J430].
Conflicts of interest
Wu, Q. is affiliated with Ningbo Fengci Technology Co., Ltd., while the other authors have declared that they have no conflicts of interest.
Ethical approval and consent to participate
Not applicable.
Consent for publication
Not applicable.
Copyright
© The Author(s) 2026.
REFERENCES
1. Derakhshani, M.; Taheri-Nassaj, E.; Jazirehpour, M.; Masoudpanah, S. M. Structural, magnetic, and gigahertz-range electromagnetic wave absorption properties of bulk Ni-Zn ferrite. Sci. Rep. 2021, 11, 9468.
2. Ding, D.; Wang, Y.; Li, X.; et al. Rational design of core-shell Co@C microspheres for high-performance microwave absorption. Carbon 2017, 111, 722-32.
3. Zhao, D.; Lv, Q.; Shen, Z. Fabrication and microwave absorbing properties of Ni-Zn spinel ferrites. J. Alloys. Compd. 2009, 480, 634-8.
4. Zhang, Y.; Gong, X.; Zeng, Y.; et al. An urchin‐inspired broadband and ultralight microwave absorber. Adv. Funct. Mater. 2025, 35, 2419943.
5. Xiang, L.; Qi, X.; Rao, Y.; et al. A simple strategy to develop heterostructured carbon paper/Co nanoparticles composites with lightweight, tunable and broadband microwave absorption. Mater. Today. Phys. 2023, 34, 101030.
6. Xu, P.; He, H.; Qi, D.; Fu, L.; Yue, X.; Zhu, X. Egg white-derived carbon/magnetic nanoparticles/water-soluble graphene oxide composite with homogeneous structure as an excellent electromagnetic wave absorber. J. Mater. Chem. C. 2021, 9, 9292-301.
7. Shao, C.; Liu, H.; Shi, Y.; Tian, N.; You, C.; Zhao, Z. Dielectric-magnetic synergy in ferrite/carbon composites for electromagnetic microwave absorption. Nano. Res. 2025, 18, 94907815.
8. Guo, J.; Sun, Y.; Chen, Z.; et al. Electrostatic self-assembled ceramic magnetic Ti3C2Tx nanocomposites reinforced with hollow Fe3O4 particles for strong and broadband absorption of electromagnetic waves. Ceram. Int. 2025, 51, 29283-91.
9. Luo, N.; Ma, Y.; Ni, Z.; Chen, F.; Fu, Q. Preparation of reduced graphene oxide aerogel microspheres with excellent electromagnetic microwave absorption performance. Carbon 2025, 243, 120466.
10. Wei, H.; Lei, T.; Li, W. Lightweight, flexible, heat resistant and thermal insulating aramid nanofiber/magnetic carbon nanotube interpenetrating network aerogel for microwave absorption in complex environments. Carbon 2024, 225, 119115.
11. Zhu, S.; Huang, K.; Ni, J.; et al. Magnetic and microwave absorption properties of Ni0.6Zn0.4Fe2O4/SrFe12O19 composites. Mater. Chem. Phys. 2022, 288, 126398.
12. Zhao, Q.; Liu, Y.; Rong, H.; et al. Ni-Zn 18H ferrite materials with abundant structural defects for waveband-tunable electromagnetic wave absorption. Ceram. Int. 2025, 51, 31917-25.
13. Ibrahim, R. S.; Ahmad, M. M.; Azab, A. A. CuO/MFe2O4 (M = Co, Ni and Fe) ferrite nanocomposites: synthesis, characterization, optical and magnetic properties for diverse applications. Appl. Phys. A. 2025, 131, 9050.
14. Wang, C.; Shen, Y.; Wang, X.; Zhang, H.; Xie, A. Synthesis of novel NiZn-ferrite/polyaniline nanocomposites and their microwave absorption properties. Mater. Sci. Semicond. Process. 2013, 16, 77-82.
15. Wahaab, F. A.; Adebayo, L. L.; Rostami, A.; et al. Microwave absorption performance of Ni0.5Zn0.5Fe2O4 nanoclusters at 8.2-18 GHz frequency. Indian. J. Phys. 2022, 96, 723-33.
16. Singh, S.; Chaudhary, P.; Srivastava, R.; Kant, Tripathi. R.; Kumar, R.; Yadav, B. Improved growth of nano tin ferrites with their decoration on carbon foam for wastewater treatment. Environ. Nanotechnol. Monit. Manag. 2021, 16, 100546.
17. Bychanok, D.; Li, S.; Sanchez-sanchez, A.; et al. Hollow carbon spheres in microwaves: Bio inspired absorbing coating. Appl. Phys. Lett. 2016, 108, 013701.
18. Tang, Y.; Yin, P.; Zhang, L.; et al. Novel carbon encapsulated zinc ferrite/MWCNTs composite: preparation and low-frequency microwave absorption investigation. Ceram. Int. 2020, 46, 28250-61.
19. Zong, M.; Huang, Y.; Zhang, N. Reduced graphene oxide-Ni0.5Zn0.5Fe2O4 composite: synthesis and electromagnetic absorption properties. Mater. Lett. 2015, 145, 115-9.
20. Zhou, X.; Shen, L.; Li, L.; et al. Preparation of nanocrystalline-coated carbon nanotube/Ni0.5Zn0.5Fe2O4 composite with excellent electromagnetic property as microwave absorber. J. Phys. D. Appl. Phys. 2013, 46, 145002.
21. Li, Z.; Yang, Z. Microwave absorption properties and mechanism for hollow Fe3O4 nanosphere composites. J. Magn. Magn. Mater. 2015, 387, 131-8.
22. Aslam, M. A.; Hu, K.; Ding, W.; et al. Dimensionality determined microwave absorption properties in ferrite/bio-carbon composites. Ceram. Int. 2021, 47, 27496-502.
23. Bao, S.; Zhang, M.; Bu, X.; Zhang, W.; Jiang, Z.; Xie, Z. Combinatorial structural engineering of multichannel hierarchical hollow microspheres assembled from centripetal Fe/C nanosheets to achieve effective integration of sound absorption and microwave absorption. ACS. Appl. Mater. Interfaces. 2023, 15, 13565-75.
24. Ge, J.; Liu, S.; Liu, L.; et al. Optimizing the electromagnetic wave absorption performance of designed hollow CoFe2O4/CoFe@C microspheres. J. Mater. Sci. Technol. 2021, 81, 190-202.
25. Sui, M.; Sun, X.; Lou, H.; et al. Synthesis of hollow Fe3O4 particles via one-step solvothermal approach for microwave absorption materials: effect of reactant concentration, reaction temperature and reaction time. J. Mater. Sci. Mater. Electron. 2018, 29, 7539-50.
26. Mandal, D.; Gorai, A.; Mandal, K. Electromagnetic wave trapping in NiFe2O4 nano-hollow spheres: an efficient microwave absorber. J. Magn. Magn. Mater. 2019, 485, 43-8.
27. Zhu, X.; Dong, Y.; Pan, F.; et al. Covalent organic framework-derived hollow core-shell Fe/Fe3O4@porous carbon composites with corrosion resistance for lightweight and efficient microwave absorption. Compos. Commun. 2021, 25, 100731.
28. Zhang, M.; Liu, Q.; Zi, Z.; et al. Magnetic and microwave absorption properties of Ni1-xZnxFe2O4 nanocrystalline synthesized by sol-gel method. Sci. China. Technol. Sci. 2013, 56, 13-9.
29. Xu, Y.; Xiong, S.; Weng, S.; et al. Rationally designed Ni2P/Ni/C as a positive electrode for high-performance hybrid supercapacitors. New. J. Chem. 2020, 44, 6810-7.
30. Okamura, M.; Takagaki, A.; Toda, M.; et al. Acid-catalyzed reactions on flexible polycyclic aromatic carbon in amorphous carbon. Chem. Mater. 2006, 18, 3039-45.
31. Zhou, X.; Jia, Z.; Zhang, X.; et al. Controllable synthesis of Ni/NiO@porous carbon hybrid composites towards remarkable electromagnetic wave absorption and wide absorption bandwidth. J. Mater. Sci. Technol. 2021, 87, 120-32.
32. Bhattacharjee, K.; Pati, S. P.; Das, G. C.; Das, D.; Chattopadhyay, K. K. Effect of particle size distribution on the structure, hyperfine, and magnetic properties of Ni0.5Zn0.5Fe2O4 nanopowders. J. Appl. Phys. 2014, 116, 233907.
33. Anupama, M.; Rudraswamy, B.; Dhananjaya, N. Investigation on impedance response and dielectric relaxation of Ni-Zn ferrites prepared by self-combustion technique. J. Alloys. Compd. 2017, 706, 554-61.
34. Gómez CA, Barrero Meneses CA, Jaén JA. Raman, infrared and Mössbauer spectroscopic studies of solid-state synthesized Ni-Zn ferrites. J. Magn. Magn. Mater. 2020, 505, 166710.
35. Li, W.; Qi, H.; Niu, X.; et al. Fe-Fe3C/C microspheres as a lightweight microwave absorbent. RSC. Adv. 2016, 6, 24820-6.
36. Cheng, Y.; Zhao, H.; Yang, Z.; et al. An unusual route to grow carbon shell on Fe3O4 microspheres with enhanced microwave absorption. J. Alloys. Compd. 2018, 762, 463-72.
37. Li, Z.; Lai, X.; Wang, H.; Mao, D.; Xing, C.; Wang, D. General synthesis of homogeneous hollow core-shell ferrite microspheres. J. Phys. Chem. C. 2009, 113, 2792-7.
38. Hao, A.; Ismail, M.; He, S.; et al. Enhanced resistive switching and magnetic properties of Gd-doped NiFe2O4 thin films prepared by chemical solution deposition method. Mater. Sci. Eng. B. 2018, 229, 86-95.
39. Zhai, Y.; Li, C.; Xu, G.; Ma, Y.; Liu, X.; Zhang, Y. Depolymerization of lignin via a non-precious Ni-Fe alloy catalyst supported on activated carbon. Green. Chem. 2017, 19, 1895-903.
40. Yun, X.; Wu, Q.; Feng, L.; et al. Microwave absorption enhancement of e-Fe3O4@C microspheres by core surface modification. J. Alloys. Compd. 2020, 835, 155307.
41. Liu, R.; Zhang, Y.; Duan, L.; Zhao, X. Effect of Fe2+/Fe3+ ratio on photocatalytic activities of Zn1-xFexO nanoparticles fabricated by the auto combustion method. Ceram. Int. 2020, 46, 1-7.
42. Jia, Z.; Kong, M.; Yu, B.; Ma, Y.; Pan, J.; Wu, G. Tunable Co/ZnO/C@MWCNTs based on carbon nanotube-coated MOF with excellent microwave absorption properties. J. Mater. Sci. Technol. 2022, 127, 153-63.
43. Liu, Y.; Li, Y.; Jiang, K.; Tong, G.; Lv, T.; Wu, W. Controllable synthesis of elliptical Fe3O4@C and Fe3O4/Fe@C nanorings for plasmon resonance-enhanced microwave absorption. J. Mater. Chem. C. 2016, 4, 7316-23.
44. Wang, Y.; Xian, G.; Wu, C.; et al. Ultra-thin Ni@nitrogen-doped polyaniline-derived carbon composites with broadband electromagnetic wave absorption. New. J. Chem. 2023, 47, 17032-41.
45. Zang, J.; Li, H.; Li, Z.; et al. Excellent microwave absorption of porous rod spinel by exceeding the Snoek limit via fibrosis and grain refinements. J. Mater. Chem. C. 2024, 12, 18458-71.
46. Zhou, J.; Shu, X.; Wang, Y.; et al. Enhanced microwave absorption properties of (1-x)CoFe2O4/xCoFe composites at multiple frequency bands. J. Magn. Magn. Mater. 2020, 493, 165699.
47. Zhang, W.; Tan, G.; Hu, J.; Wang, Q.; Yan, W.; Man, Q. Enhancing electromagnetic wave absorption performance through co-regulation of microstructure and spatial orientation of RE-Ni MOF. Chem. Eng. J. 2023, 478, 147414.
48. Luo, K.; Zhao, B.; Xu, C.; et al. Construction of one-dimensional hierarchical MoS2/Ni3S2 composites with enhanced interfacial polarization and improved wideband microwave absorption. J. Mater. Sci. Technol. 2024, 178, 22-8.
49. Yang, P.; Deng, W.; Ruan, H.; et al. Amorphous/Graphitic carbon phase engineering of corrosion-resistant Fe@C Core-Shell nanowires for optimized dipole polarization and enhanced microwave absorption. Chem. Eng. J. 2024, 492, 152253.
50. Gao, Y.; Wu, Q.; Jia, X.; et al. Orientation architecture engineering for enhanced electromagnetic wave absorption and active-passive infrared camouflage performances. Adv. Funct. Mater. 2025, 35, 2508442.
51. Pan, J.; Guo, H.; Wang, M.; et al. Shape anisotropic Fe3O4 nanotubes for efficient microwave absorption. Nano. Res. 2020, 13, 621-9.
52. Zhang, N.; Huang, Y.; Wang, M. 3D ferromagnetic graphene nanocomposites with ZnO nanorods and Fe3O4 nanoparticles co-decorated for efficient electromagnetic wave absorption. Compos. Part. B. Eng. 2018, 136, 135-42.
53. Zhang, M.; Qiu, J.; Xin, Z.; Sun, X. In situ reduced multi-core yolk-shell Co@C nanospheres for broadband microwave absorption. Materials 2021, 14, 4610.
54. Wang, T.; Chen, G.; Zhu, J.; Gong, H.; Zhang, L.; Wu, H. Deep understanding of impedance matching and quarter wavelength theory in electromagnetic wave absorption. J. Colloid. Interface. Sci. 2021, 595, 1-5.
55. Gai, L.; Zhao, Y.; Song, G.; et al. Construction of core-shell PPy@MoS2 with nanotube-like heterostructures for electromagnetic wave absorption: Assembly and enhanced mechanism. Compos. Part. A. Appl. Sci. Manuf. 2020, 136, 105965.
56. Huang, X.; Zhang, J.; Rao, W.; Sang, T.; Song, B.; Wong, C. Tunable electromagnetic properties and enhanced microwave absorption ability of flaky graphite/cobalt zinc ferrite composites. J. Alloys. Compd. 2016, 662, 409-14.
57. Yan, L.; Men, W.; Zhang, Y.; et al. Frequency-tunable microwave absorption via balanced impedance matching in Zn0.35Ni0.65Fe2O4/Ni-Cu multiphase ferrite composites. J. Alloys. Compd. 2025, 1035, 181614.
58. Bala, M.; Shivling, V.; Tyagi, S. Enhancing X-band microwave absorption properties with nickel ferrite and carbon-based composites. Ceram. Int. 2024, 50, 34123-32.
59. Ji, X.; Deng, Y.; Xu, Z.; Chen, F. Facile synthesis of pine needle-derived carbon/CoFe2/CoFe2O4 composites with precisely tunable microwave attenuation efficiency. Mater. Today. Nano. 2025, 32, 100707.
60. Zhang, Y.; Wei, S.; Wang, B.; Liu, M.; Wang, Y.; Guo, L. Scalable mechanochemical synthesis of bifunctional MnZn ferrite/expanded graphite composites for efficient microwave absorption and corrosion resistance. J. Mater. Chem. C. 2026, 14, 743-53.
Cite This Article
How to Cite
Download Citation
Export Citation File:
Type of Import
Tips on Downloading Citation
Citation Manager File Format
Type of Import
Direct Import: When the Direct Import option is selected (the default state), a dialogue box will give you the option to Save or Open the downloaded citation data. Choosing Open will either launch your citation manager or give you a choice of applications with which to use the metadata. The Save option saves the file locally for later use.
Indirect Import: When the Indirect Import option is selected, the metadata is displayed and may be copied and pasted as needed.
About This Article
Special Topic
Copyright

Data & Comments
Data
0


Comments
Comments must be written in English. Spam, offensive content, impersonation, and private information will not be permitted. If any comment is reported and identified as inappropriate content by OAE staff, the comment will be removed without notice. If you have any queries or need any help, please contact us at [email protected].