

fig6
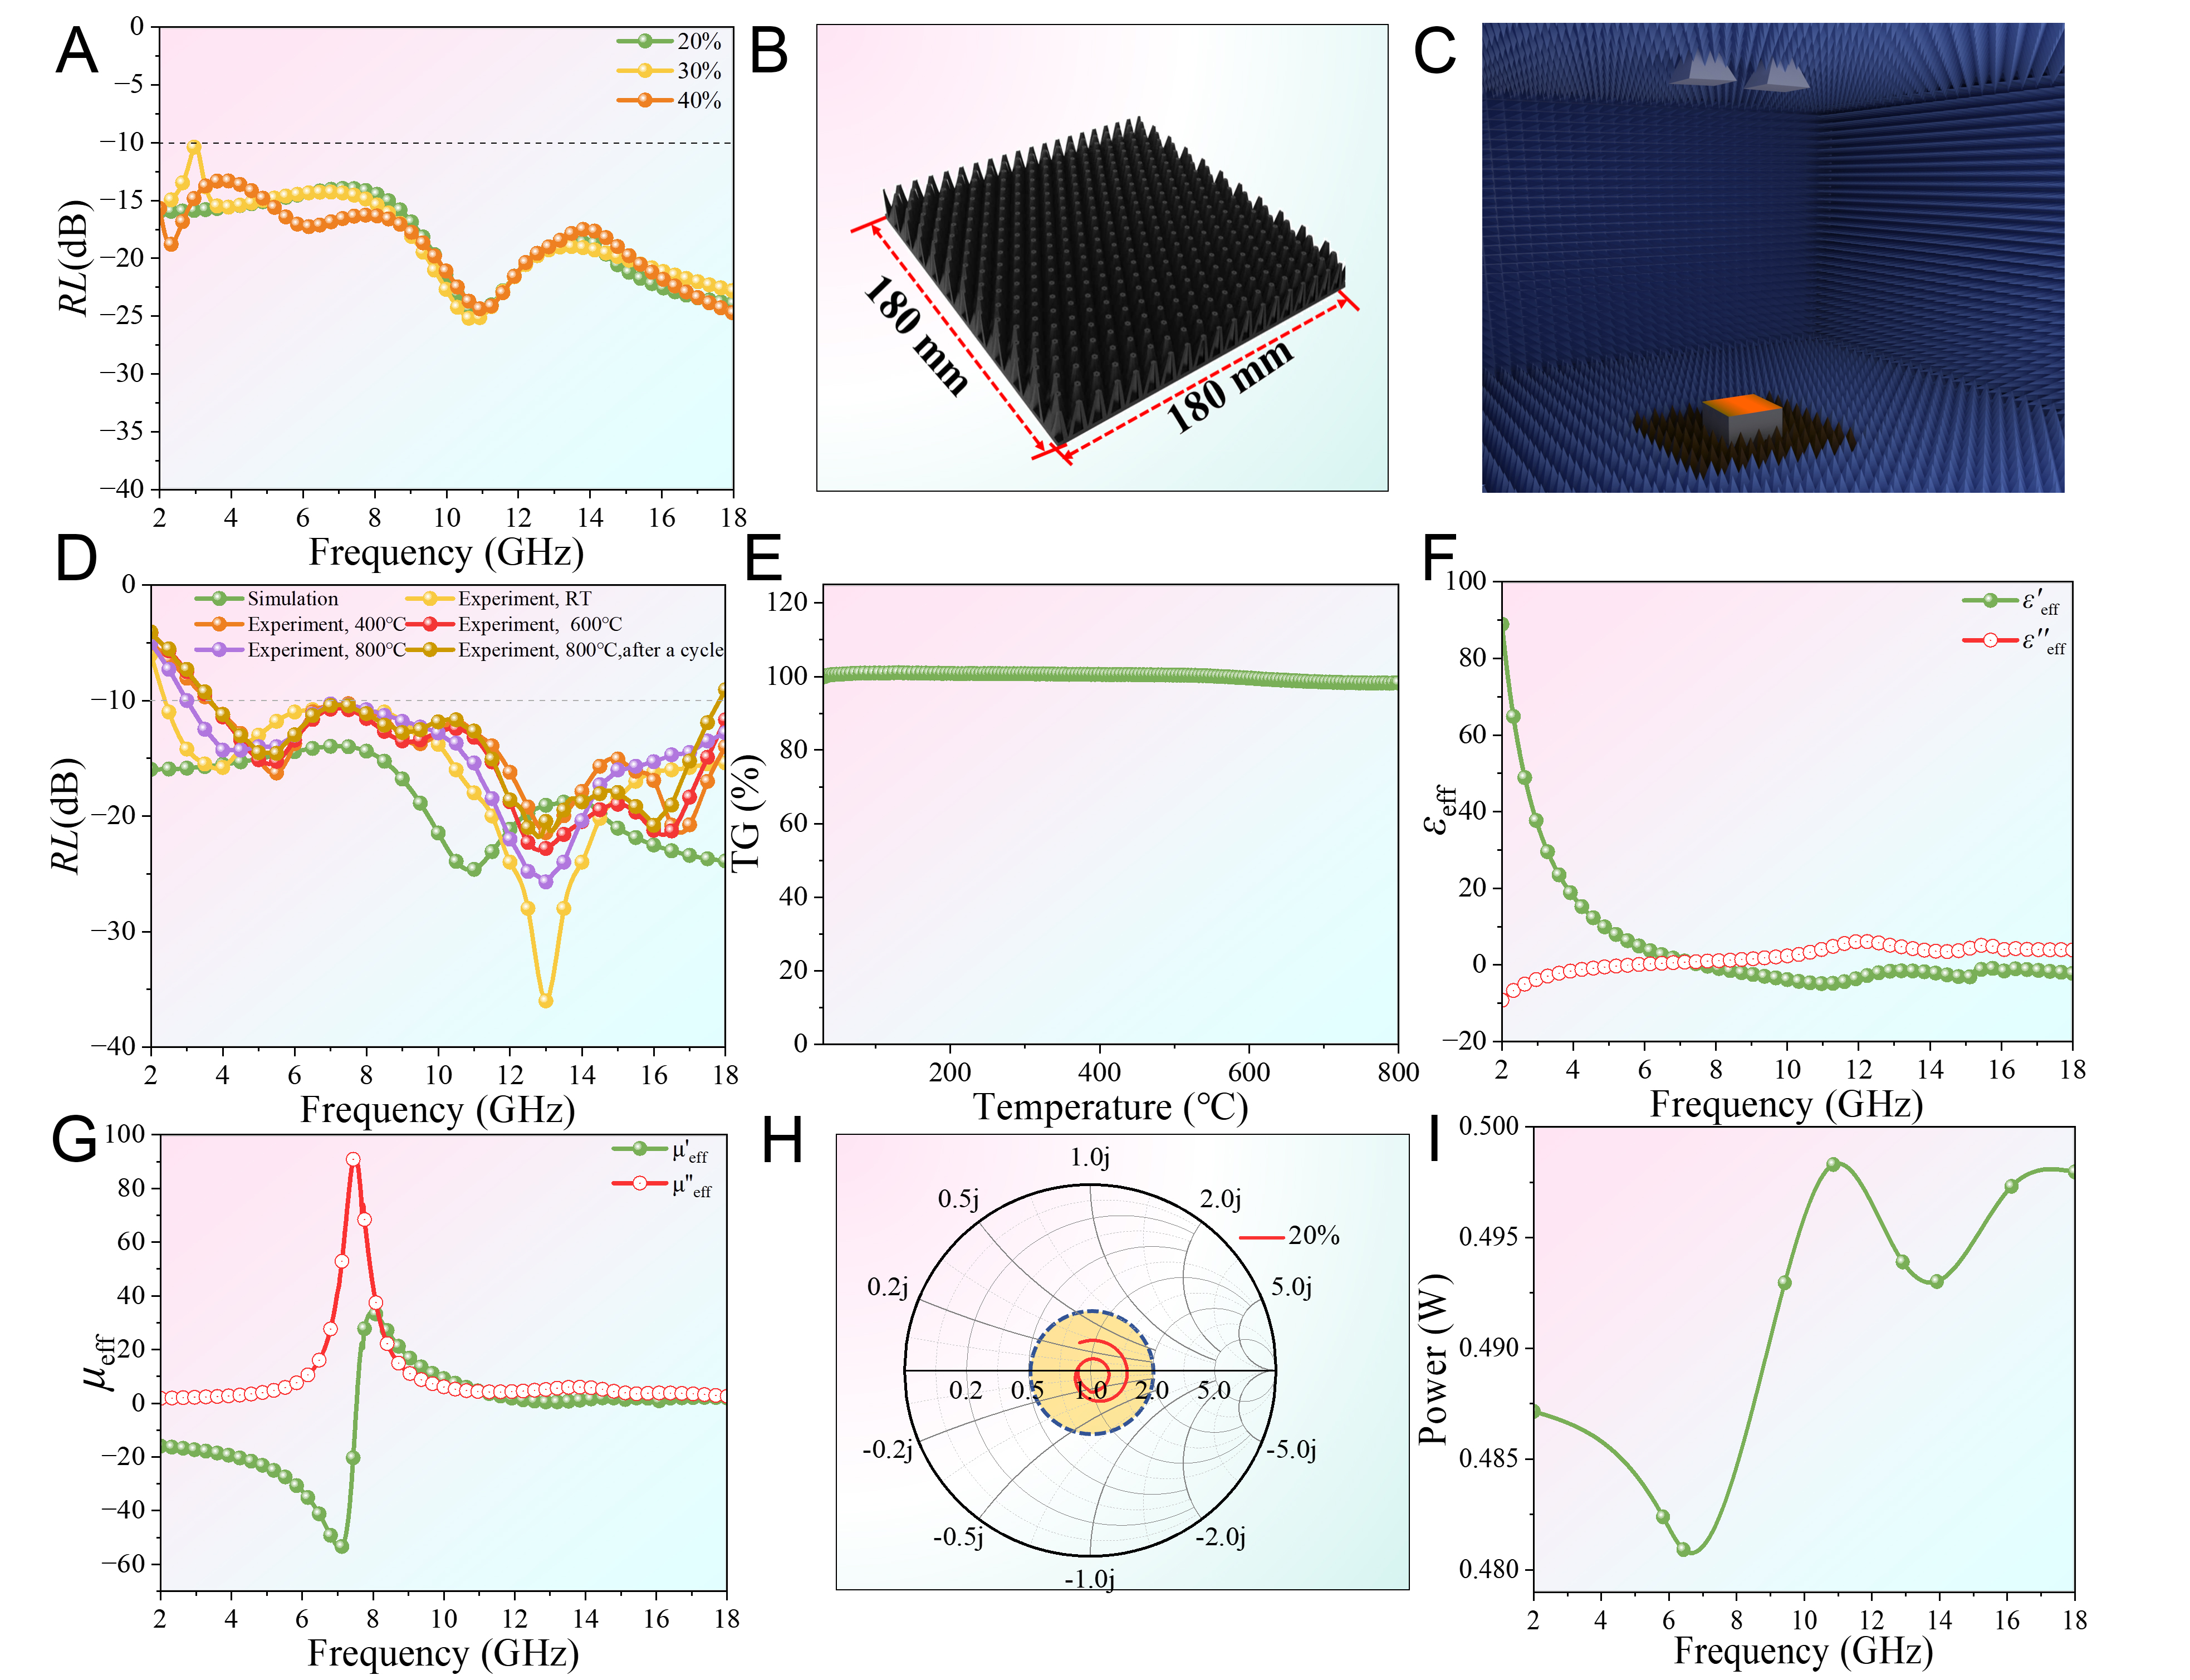
Figure 6. (A) RL with different proportions of SiBCN/FeSiAl metamaterial, (B) test sample, (C) test environment, (D) measured RL curves of the sample, (E) TG curve of the matrix material with 20% SiBCN, (F) effective dielectric constant εeff, (G) effective magnetic permeability μeff, (H) Smith chart of the metamaterial absorbers (the orange shadowed region represents impedance near perfect matching impedance; (I) Power at different frequencies of the metamaterial absorbers. TG: Thermogravimetry; RT: room temperature; RL: reflection less.





