

fig9
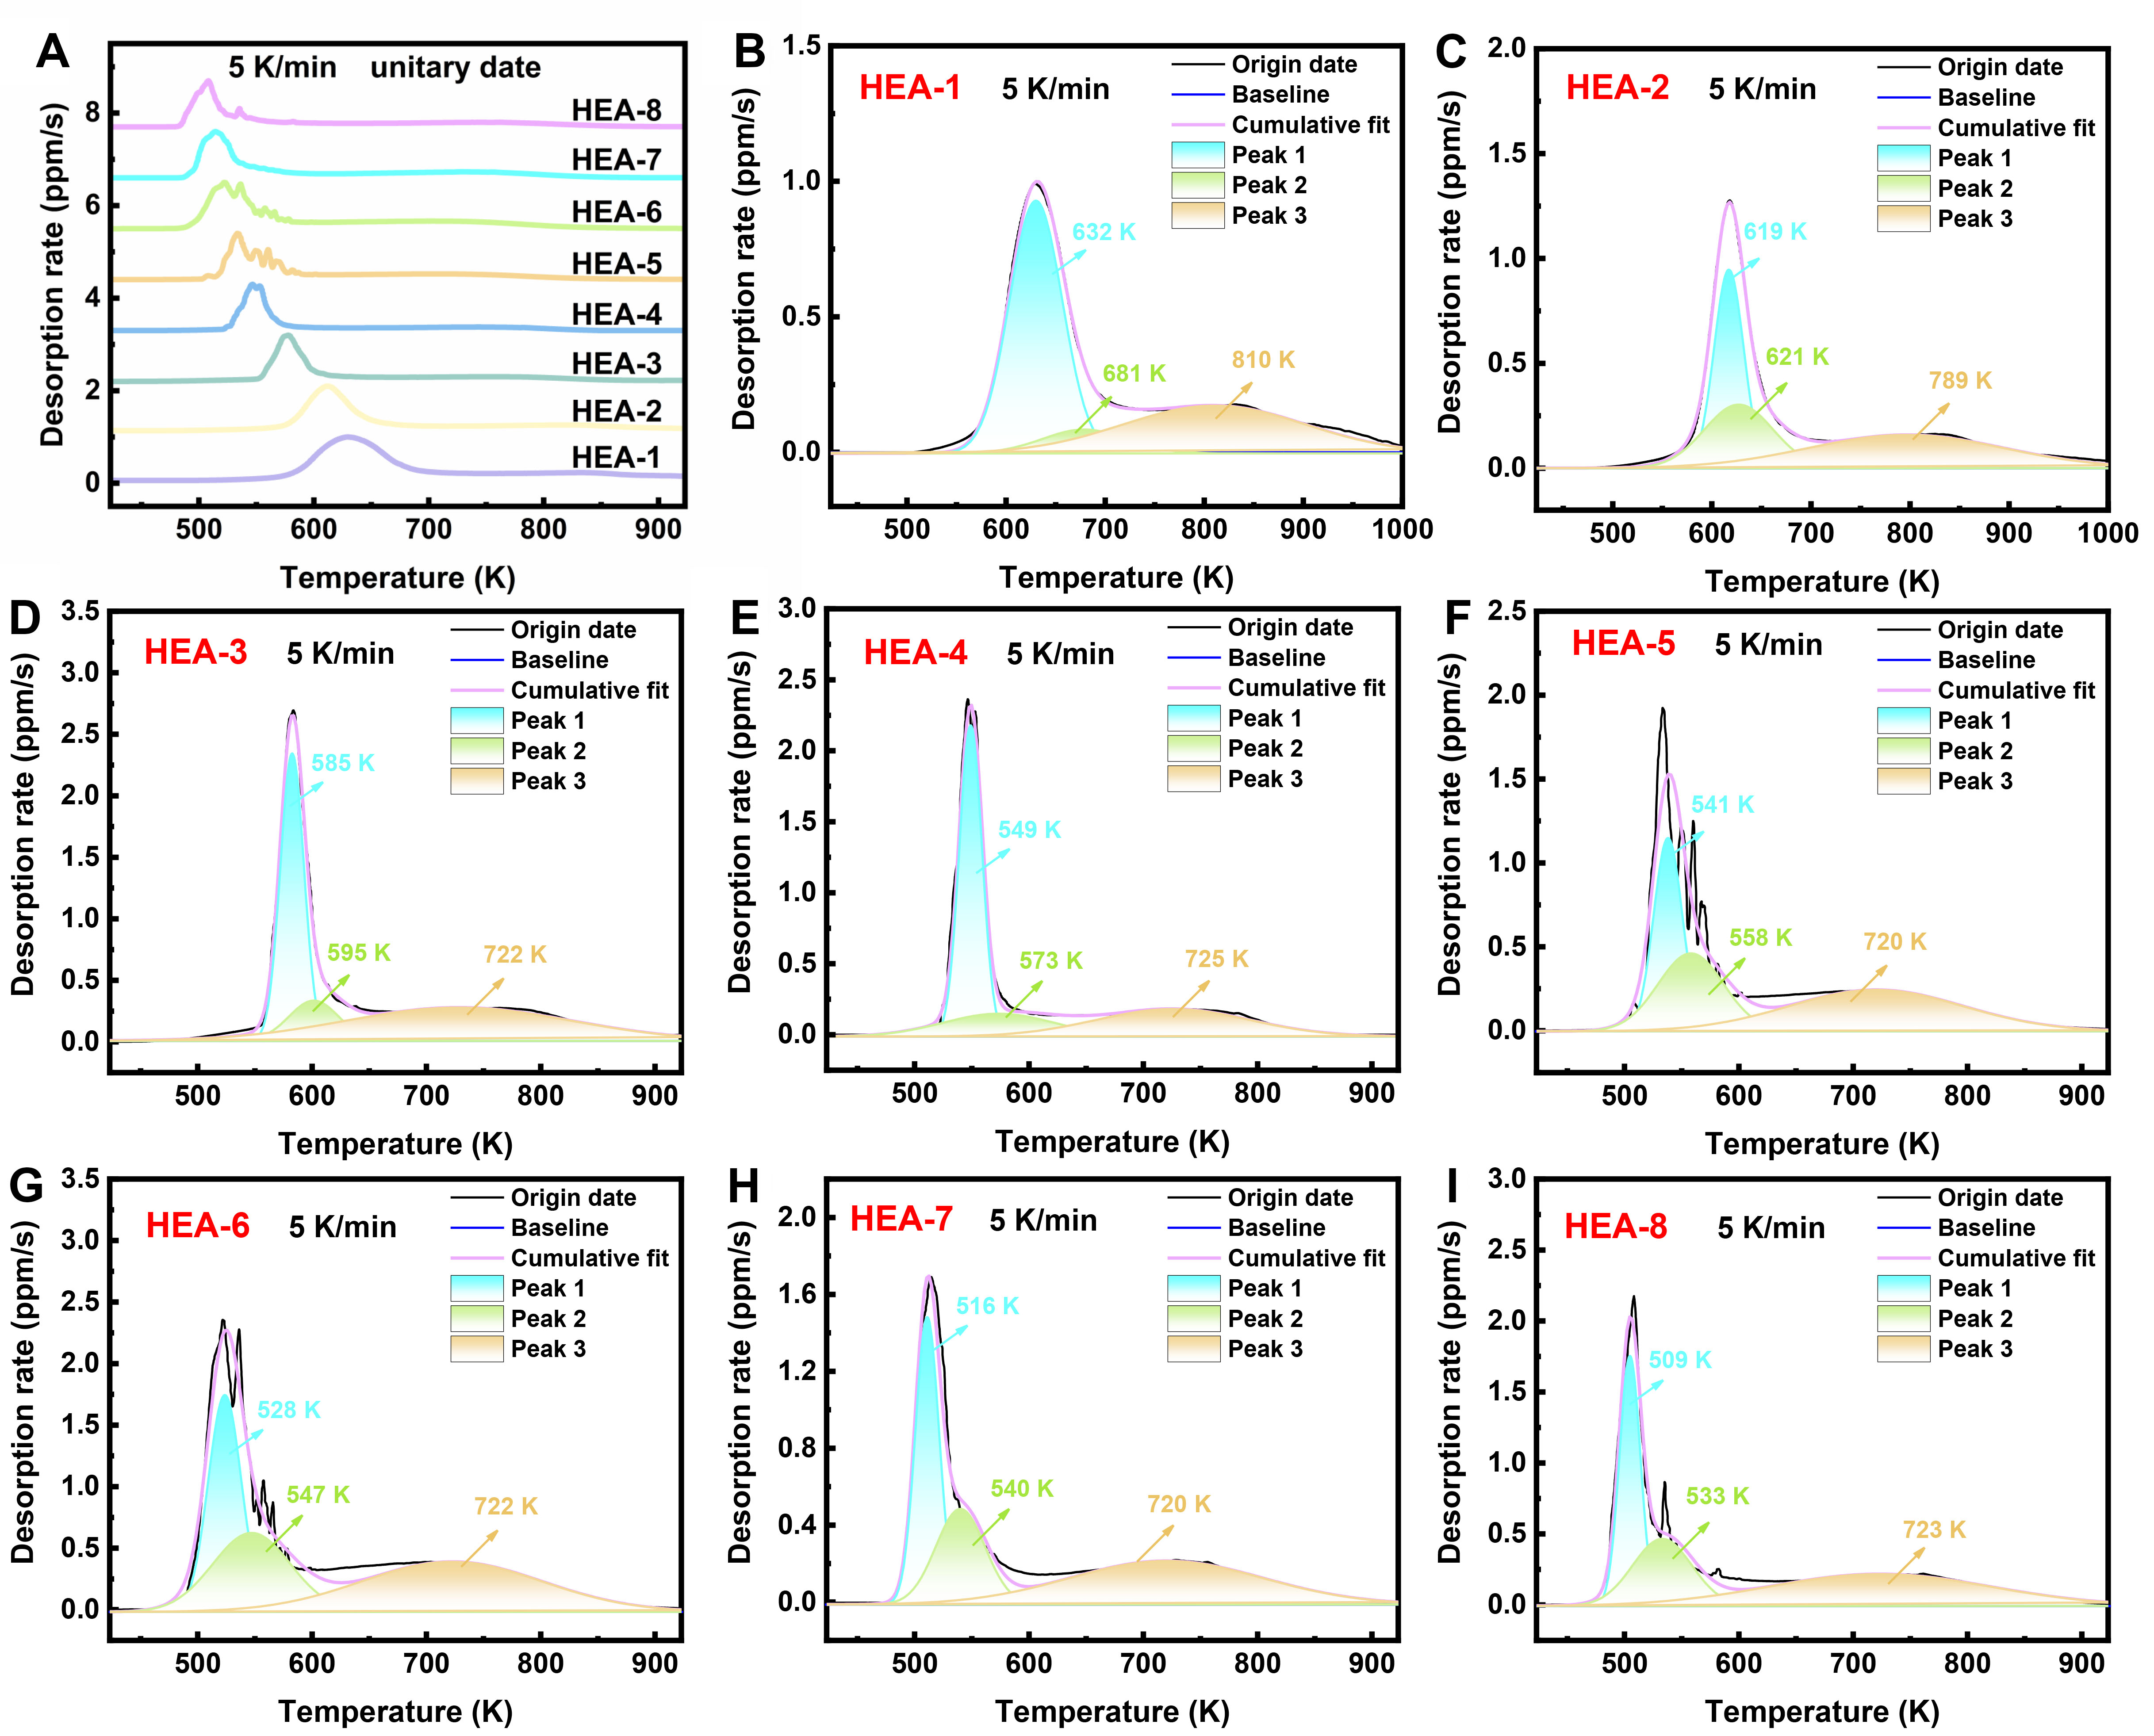
Figure 9. TDS of alloys HEA-1 to HEA-8 at a heating rate of 5 K/min: (A) comparison of TDS curves for different alloys; (B-I) peak fitting analysis of hydrogen desorption peaks. The curves in (A) are vertically offset for clarity. HEA: High-entropy alloy; TDS: thermal desorption spectroscopy.





