

fig7
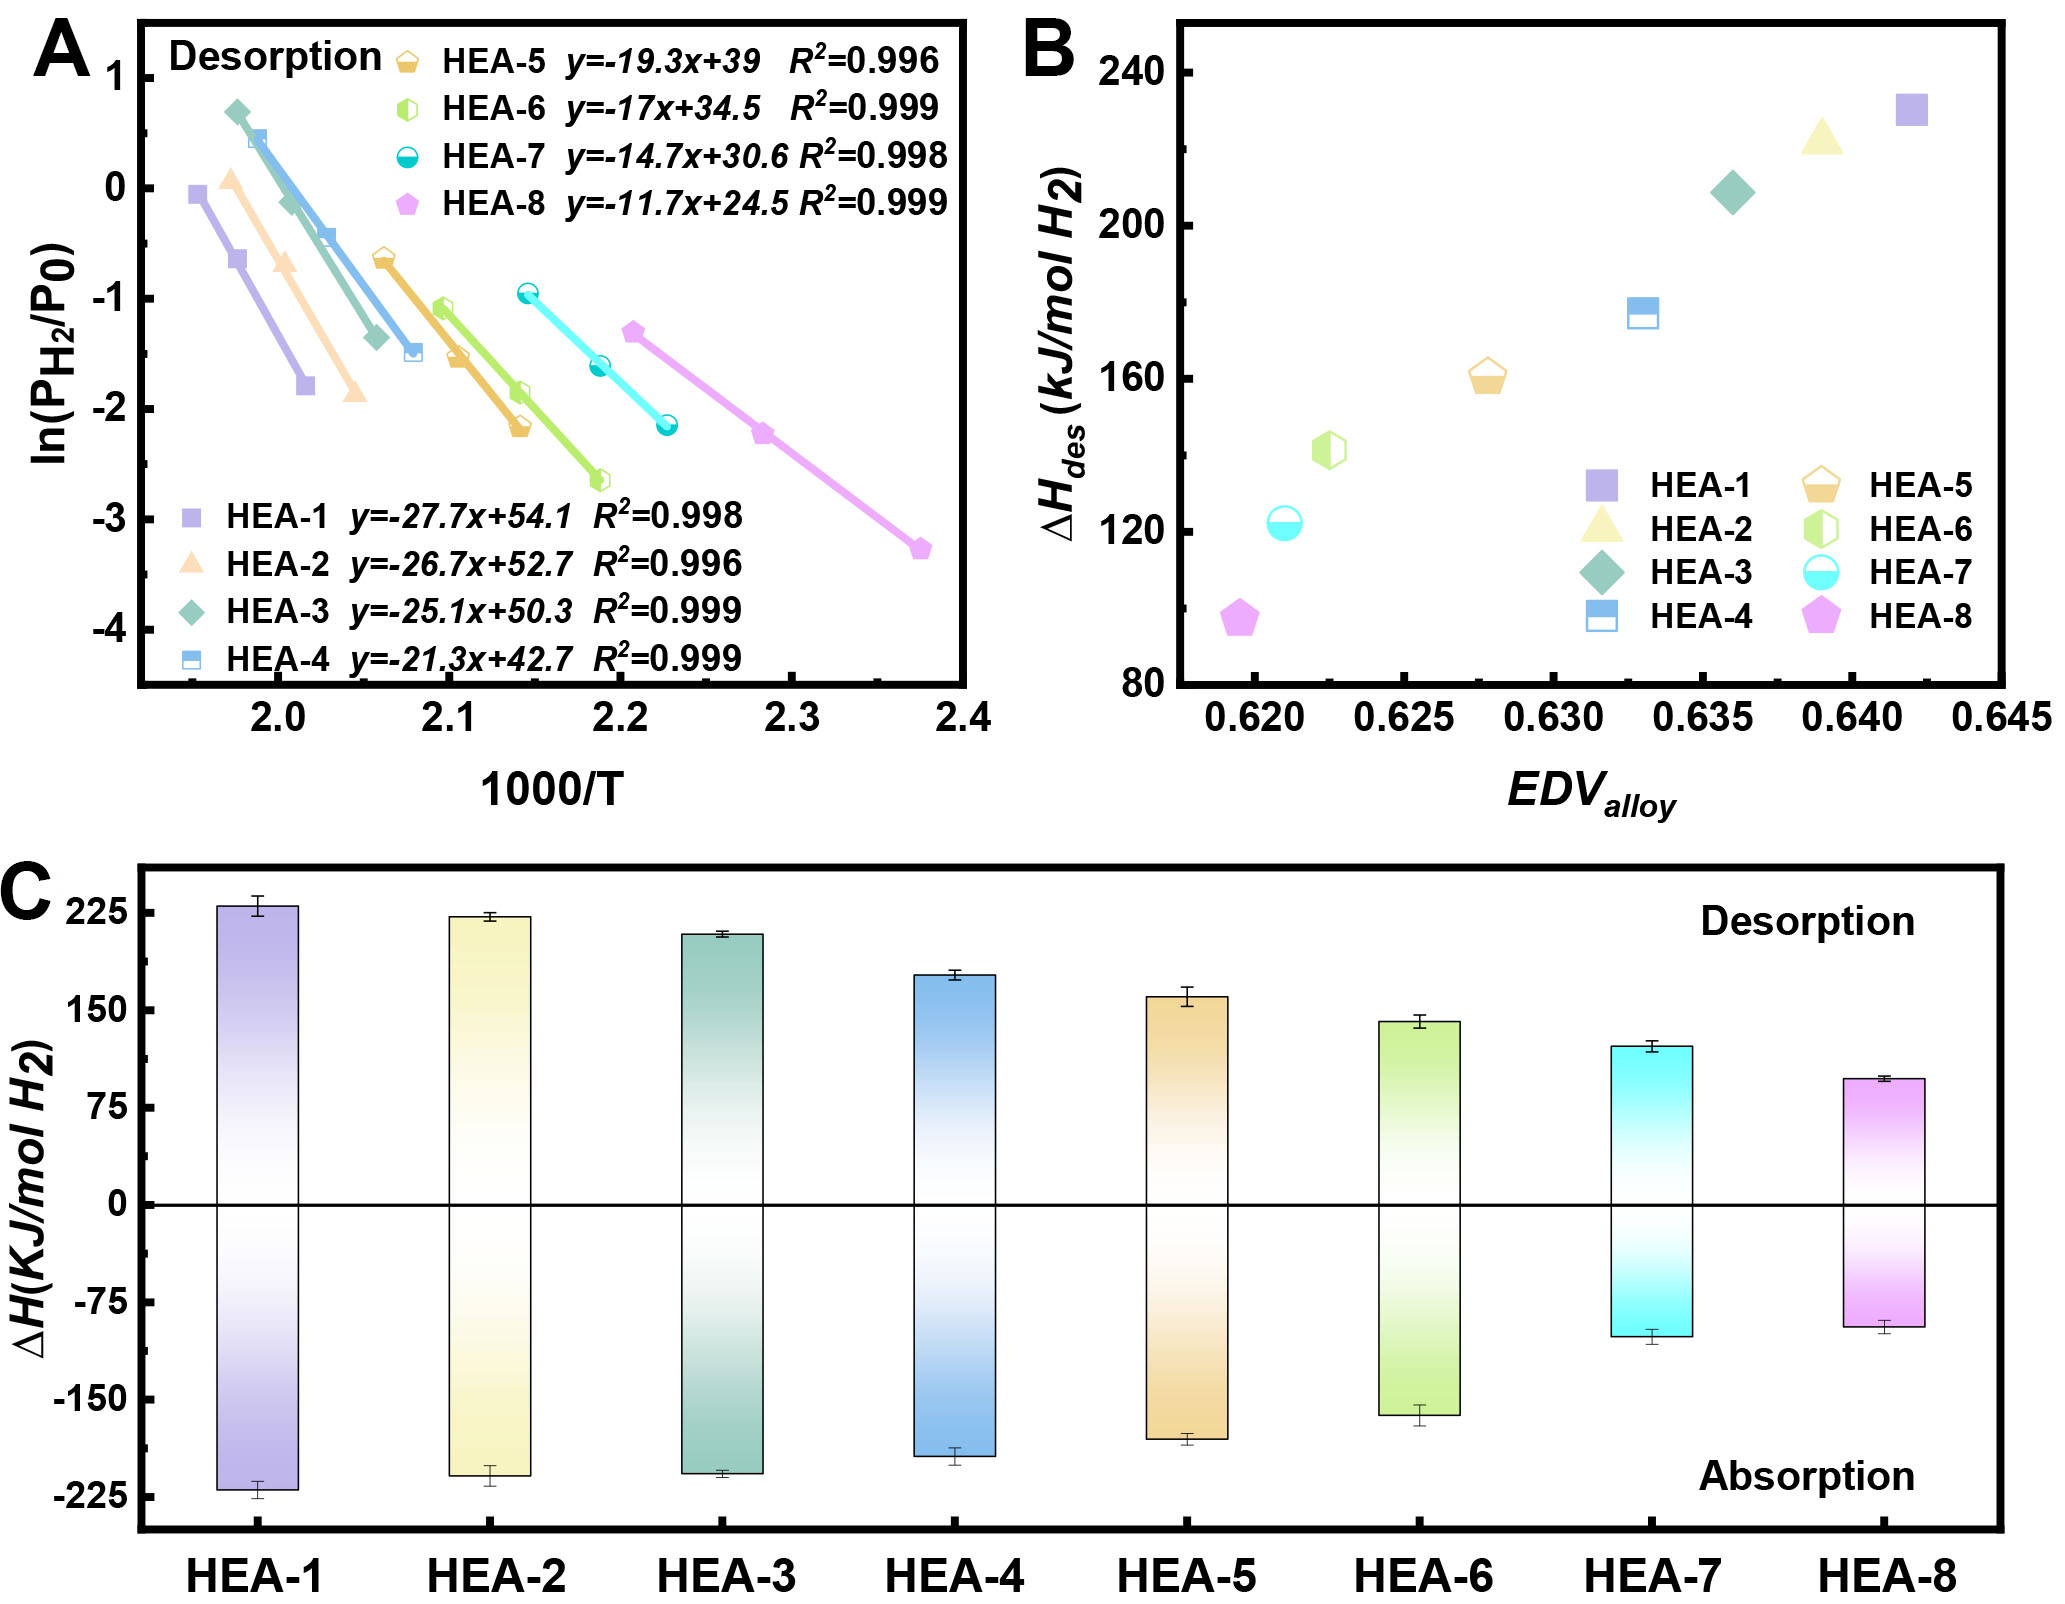
Figure 7. Van’t Hoff fitting of the hydrogen desorption process (A), the correlation between ΔHdes and EDValloy (B), and the corresponding enthalpy changes for hydrogen absorption and desorption (C) for alloys HEA-1 to HEA-8. Error bars represent the uncertainties calculated from the standard errors of the Van’t Hoff linear fittings. EDValloy: Electronegativity difference value of the alloy; HEA: high-entropy alloy; ΔHdes: desorption enthalpy.





