

fig5
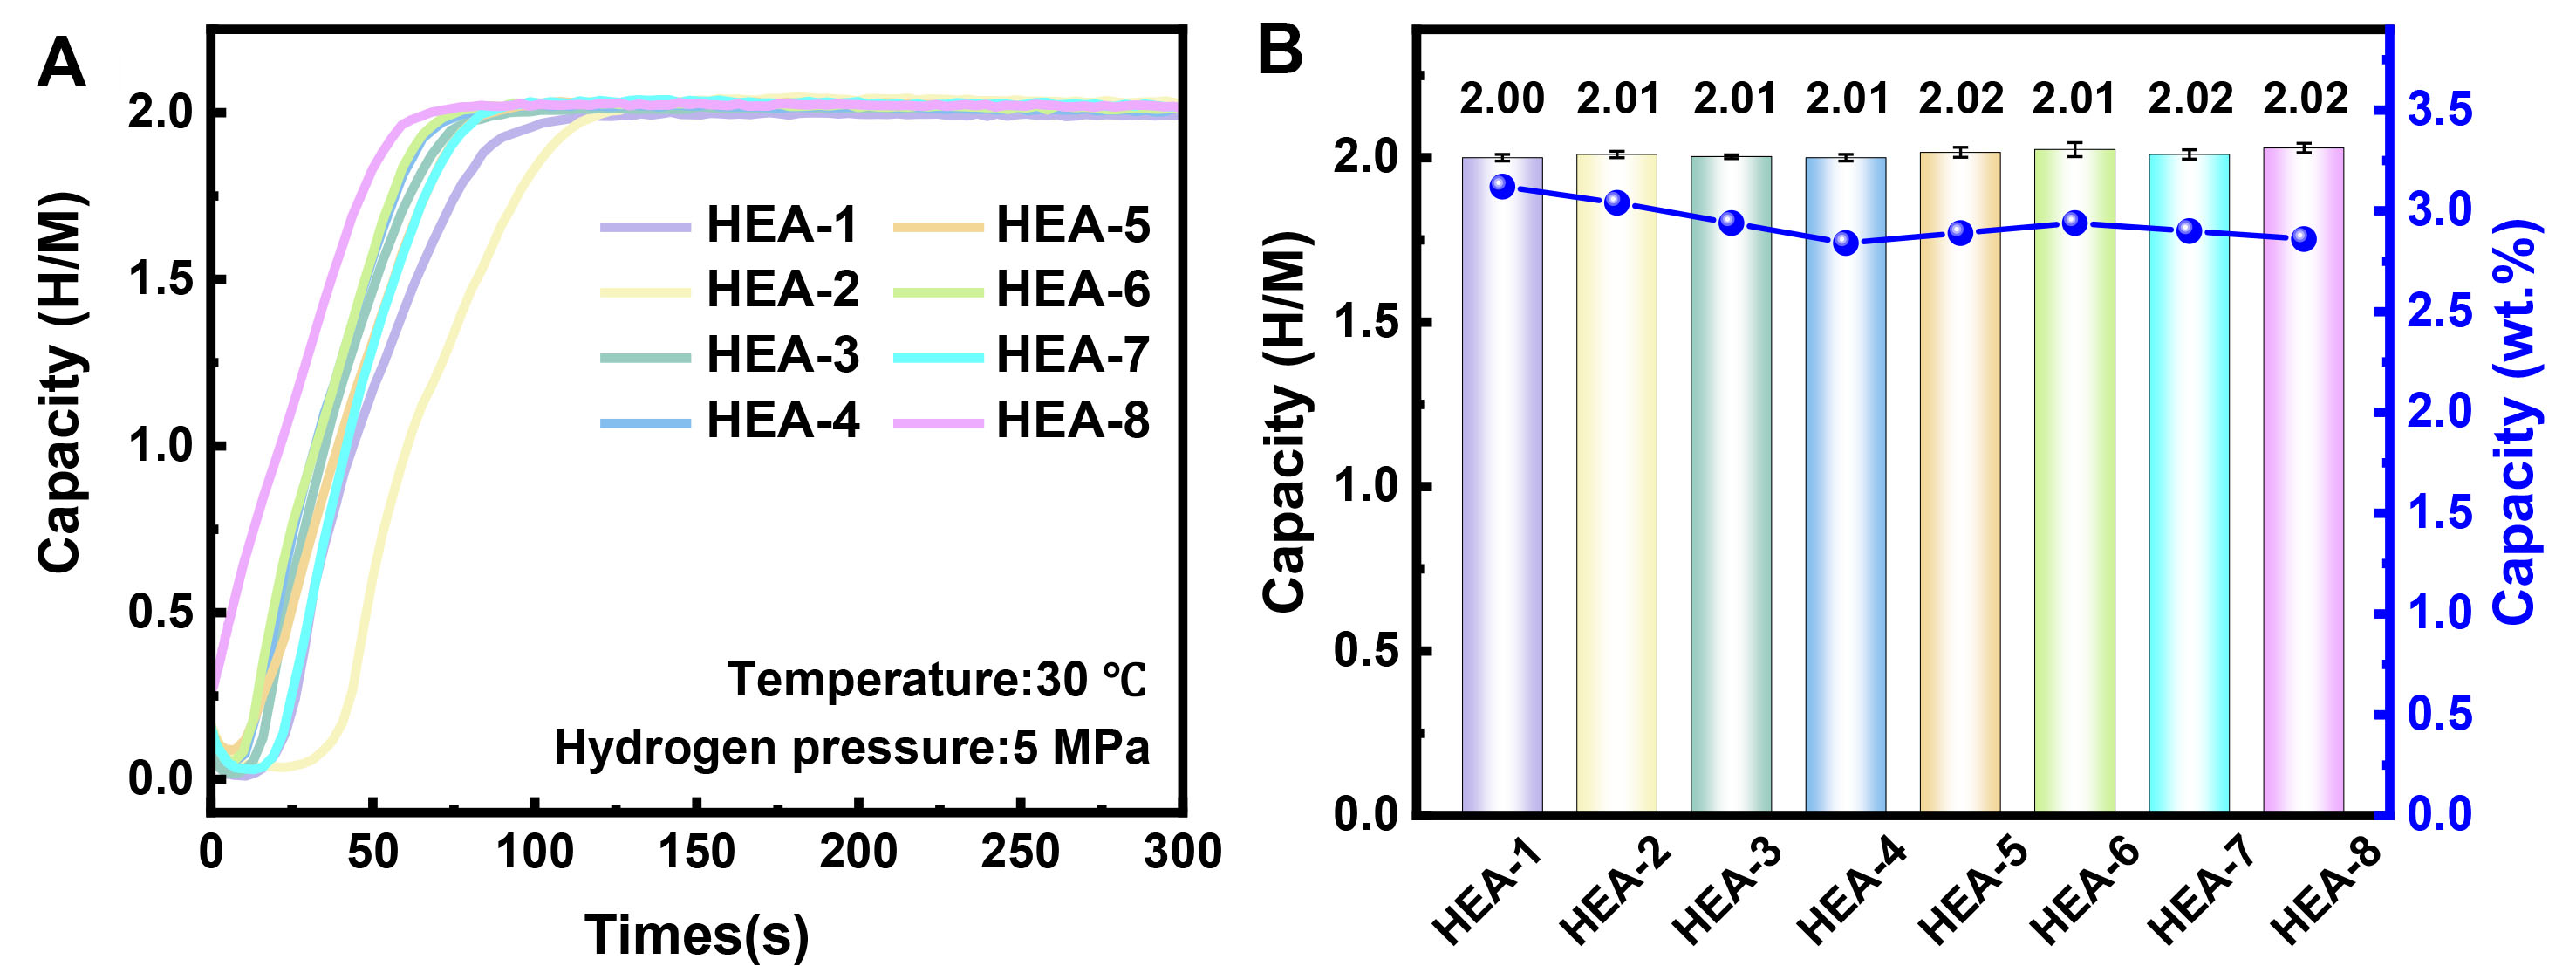
Figure 5. (A) Initial hydrogen absorption kinetics curves for activated alloys HEA-1 to HEA-8 at 303 K and 5 MPa hydrogen pressure, along with (B) their mass hydrogen storage capacity and H/M values. Error bars in (B) represent the standard deviations obtained from repeated Sievert measurements (n = 3 for HEA-1-HEA-5 and n = 2 for HEA-6-HEA-8). HEA: High-entropy alloy; H/M: hydrogen-to-metal atom ratio.





