

fig11
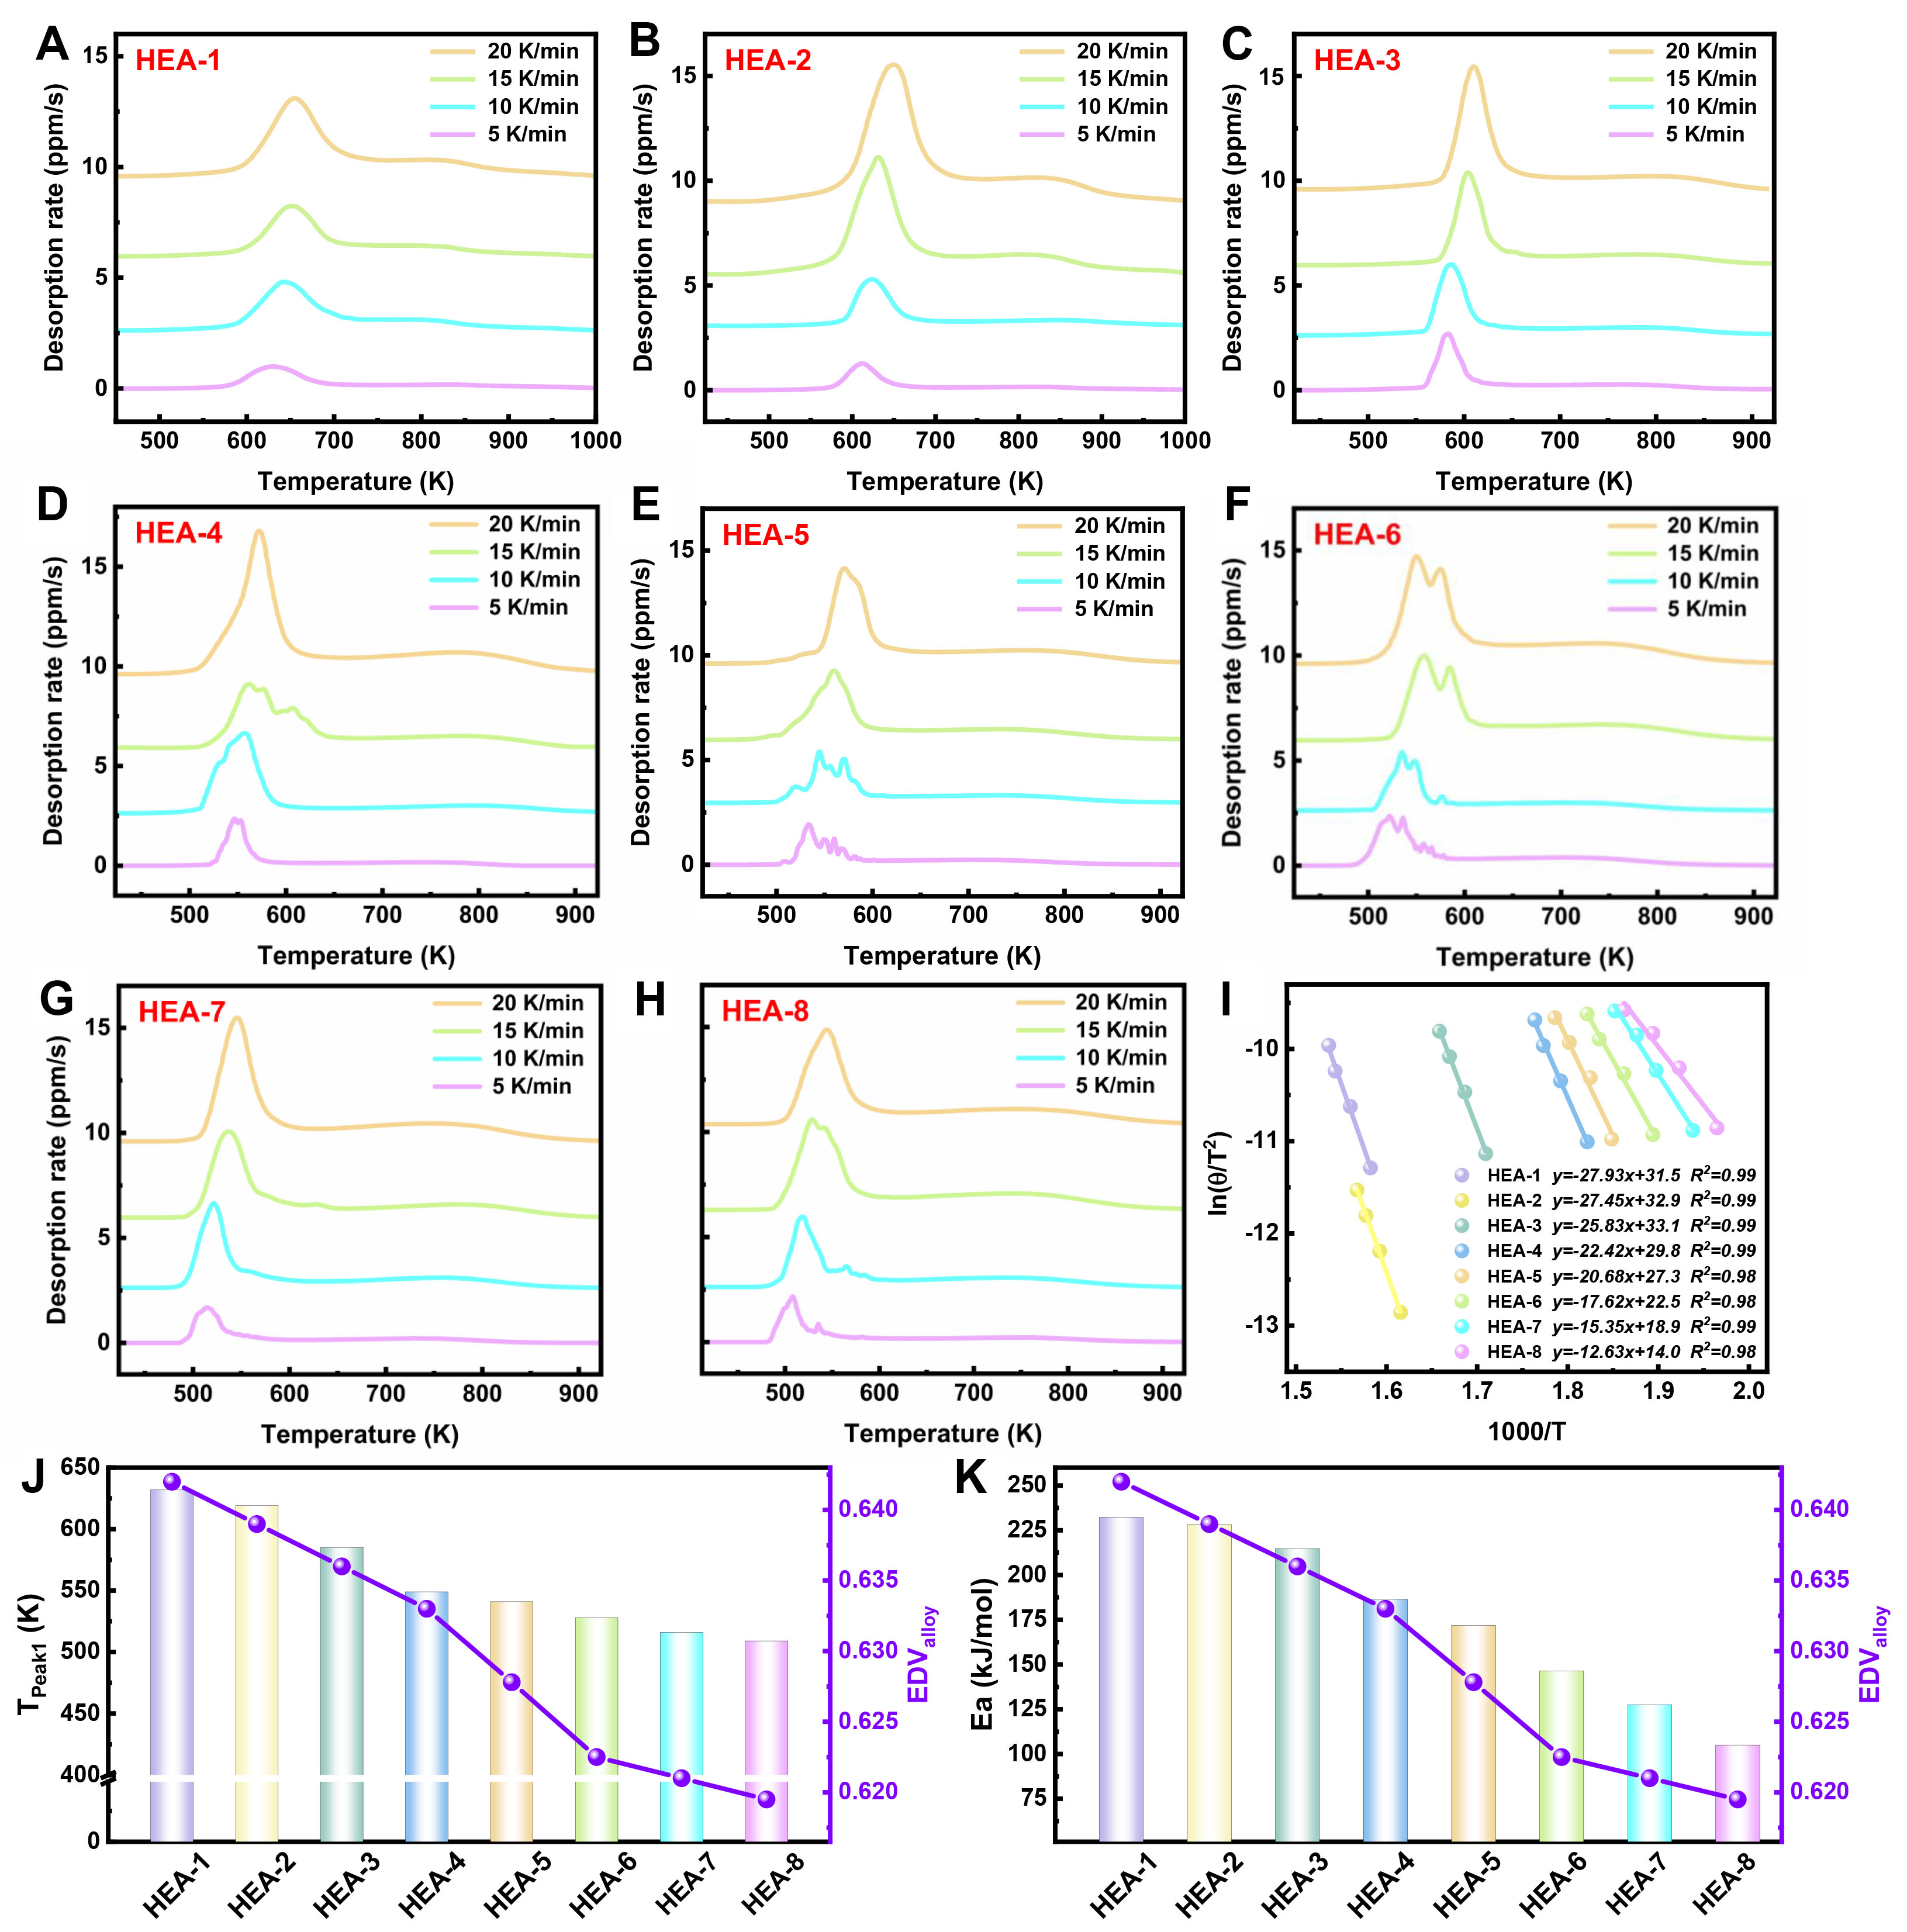
Figure 11. TDS curves for HEA-1 to HEA-8 alloys at different heating rates (5, 10, 15, 20 K/min) (A-H), corresponding Kissinger fitting results (I), the correlation between hydrogen release temperature and EDValloy (J), and the relationship between Ea and EDValloy (K). The TDS curves in (A-H) are vertically offset for clarity. HEA: High-entropy alloy; EDValloy: electronegativity difference value of the alloy; TDS: thermal desorption spectroscopy.





