

fig10
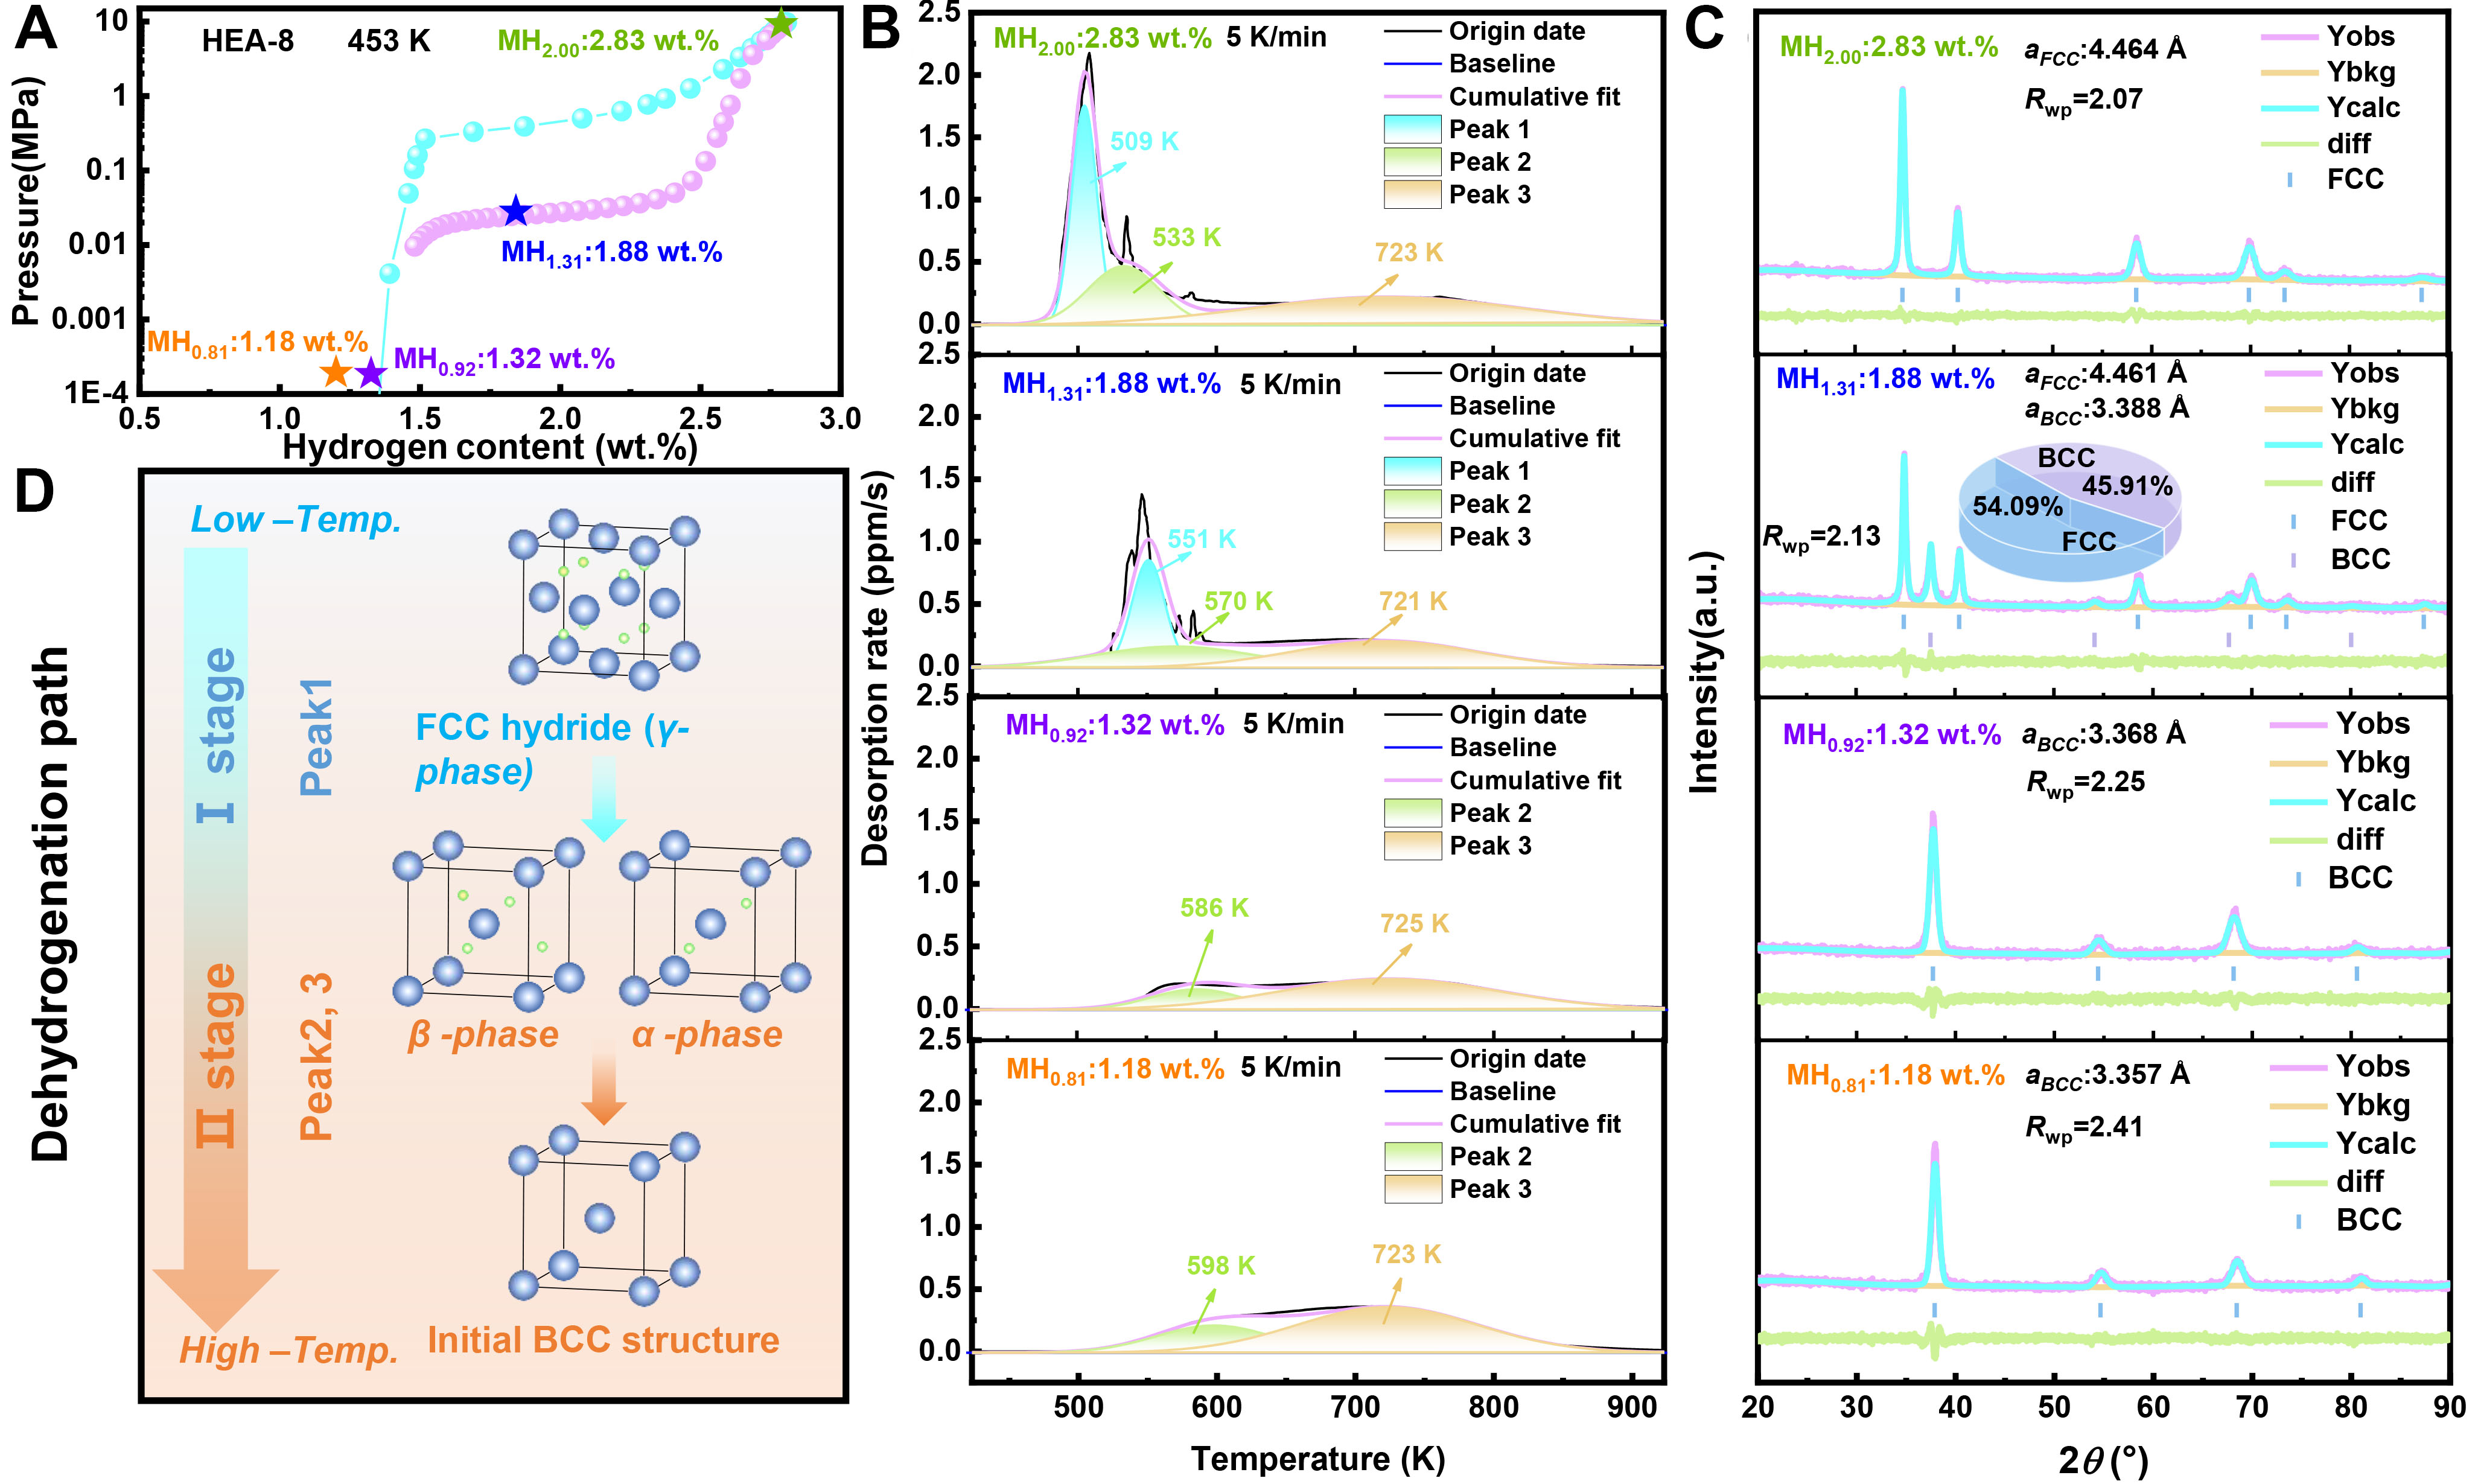
Figure 10. Analysis of the hydrogen absorption and desorption behavior of the HEA-8 alloy: (A) PCT curve at 453 K, (B) TDS spectra at different hydrogen contents, (C) corresponding XRD patterns, and (D) proposed hydrogen desorption processes corresponding to the different fitted peaks. HEA: High-entropy alloy; FCC: BCC: body-centered cubic; PCT: pressure-composition isotherm; TDS: thermal desorption spectroscopy; XRD: X-ray diffraction.





