

fig7
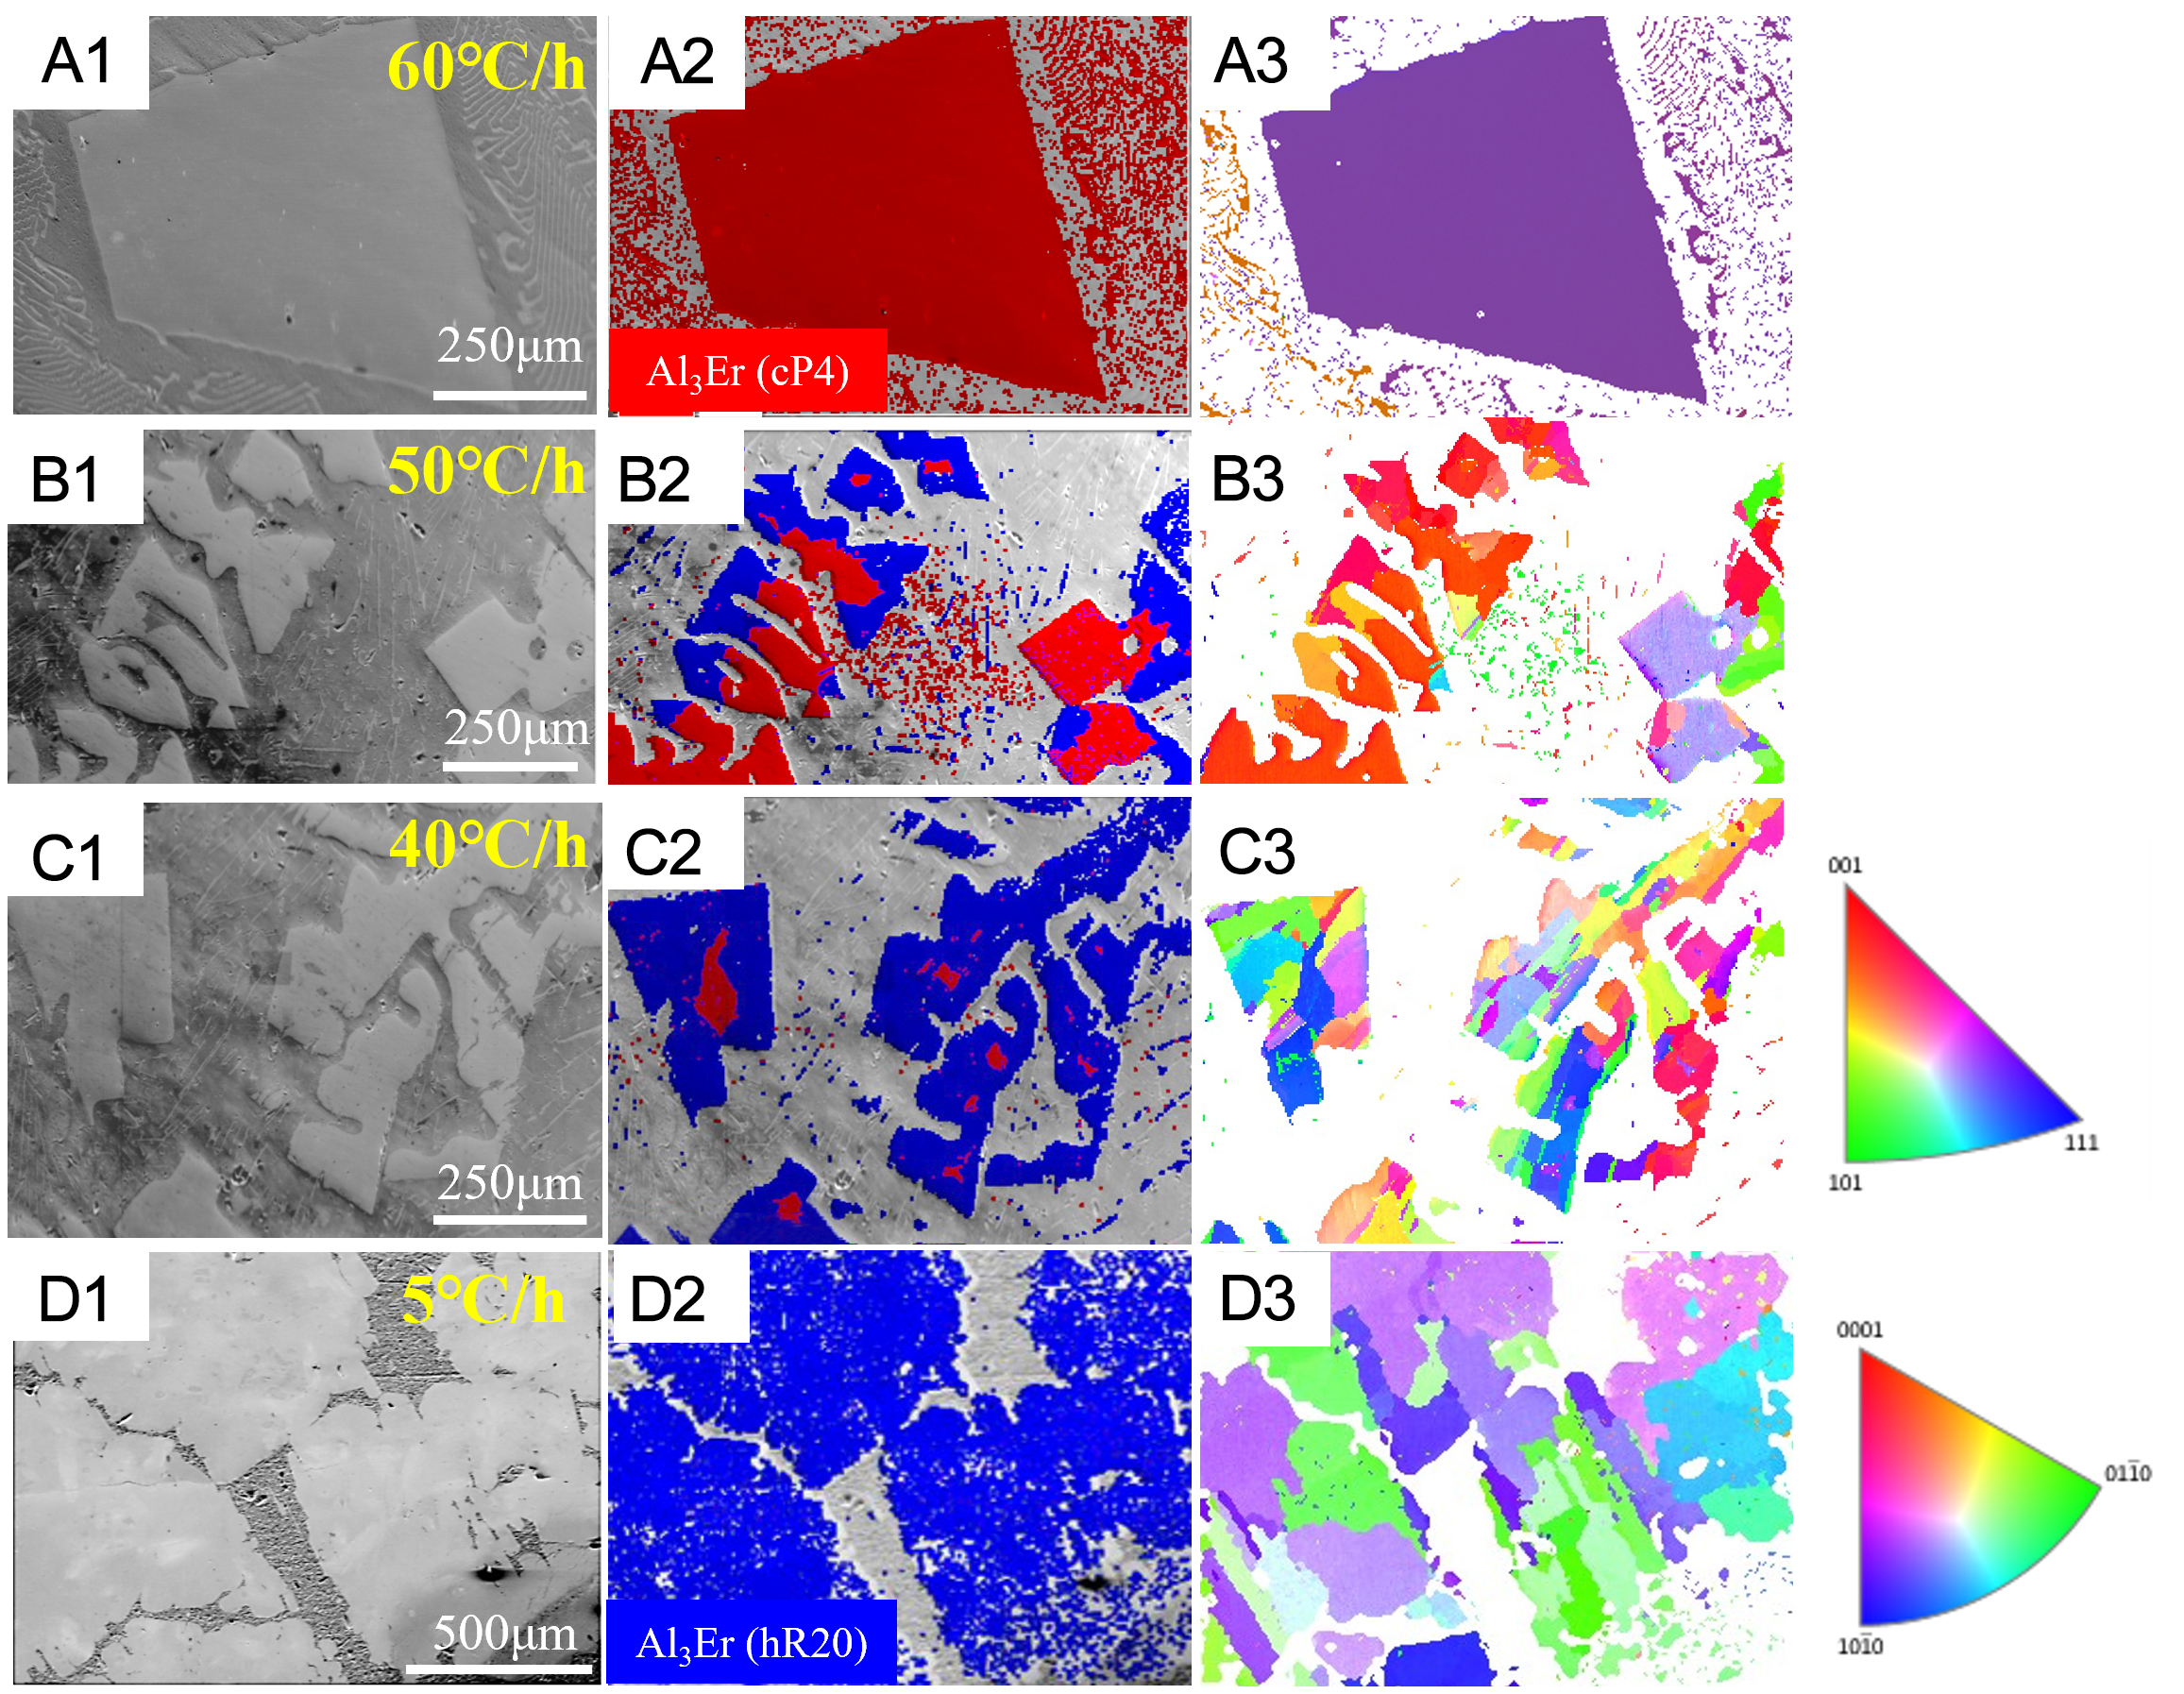
Figure 7. EBSD orientation maps of Al3Er in samples cooled at different rates: (A) 60 °C/h; (B) 50 °C/h; (C) 40 °C/h; (D) 5 °C/h; (1) microstructure diagram; (2) phase distribution diagram; (3) IPF maps. EBSD: Electron backscatter diffraction; IPF: inverse pole figure.





