

fig4
From: Exploring the oxygen vacancies and electrical properties in pyrochlore-type Ca1.46Ti1.38Nb1.11O7
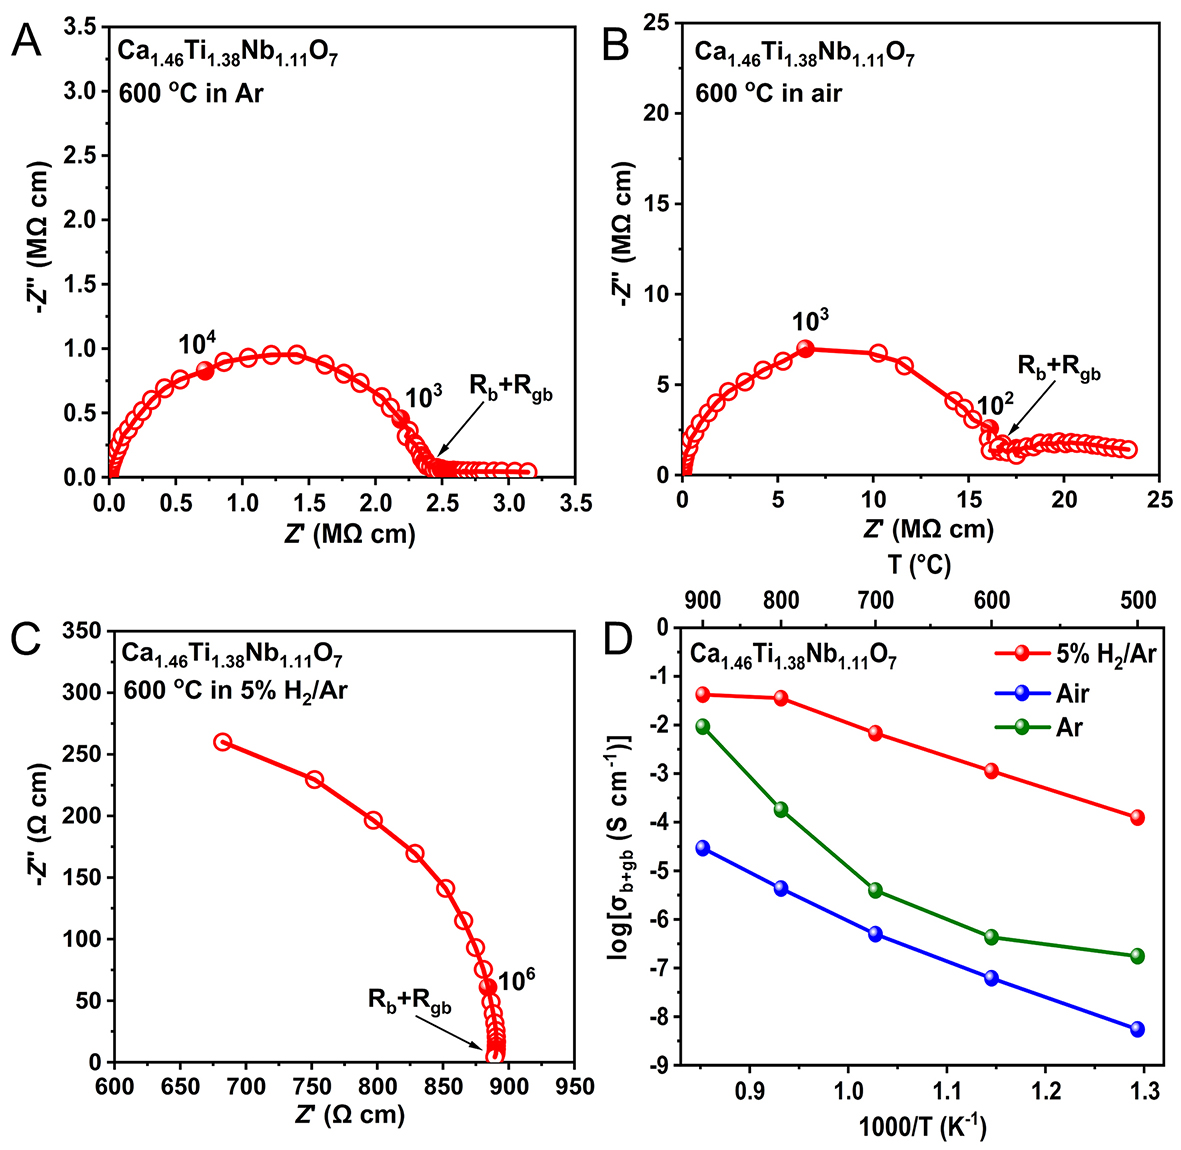
Figure 4. (A) The complex impedance plot obtained at
Figure 4. (A) The complex impedance plot obtained at


All published articles are preserved here permanently:
https://www.portico.org/publishers/oae/ All published articles are preserved here permanently:
https://www.portico.org/publishers/oae/