

fig2
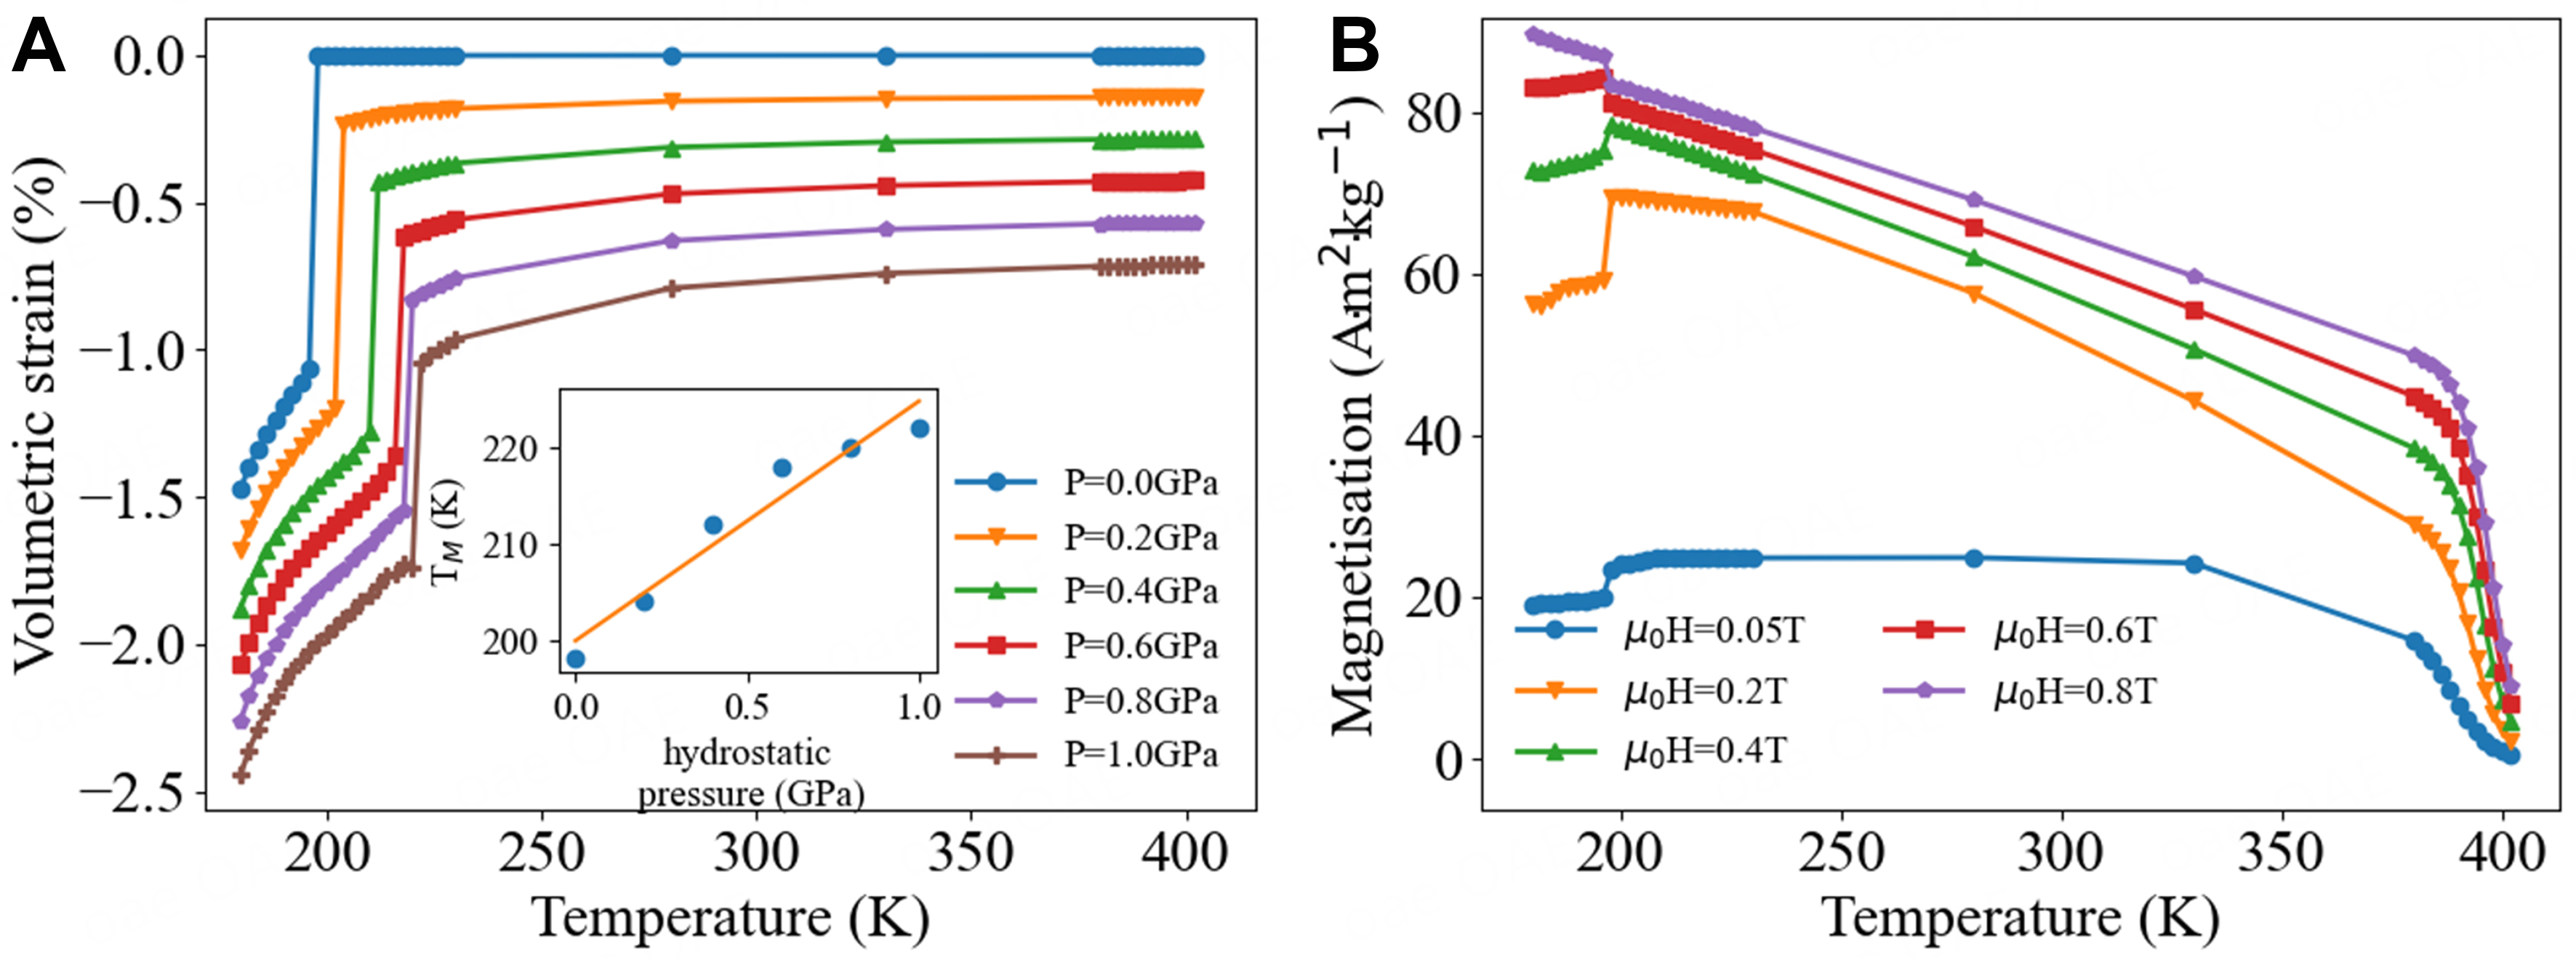
Figure 2. (A) Curves of volume strain versus temperature for Ni-Mn-Ga alloys under different hydrostatic pressures within the temperature range of 180 to 400 K. The inset shows that the martensitic transformation temperature increases with increasing applied hydrostatic pressure; (B) M (T) curves under different external magnetic fields at the range of 180 to 400 K.





