


fig4
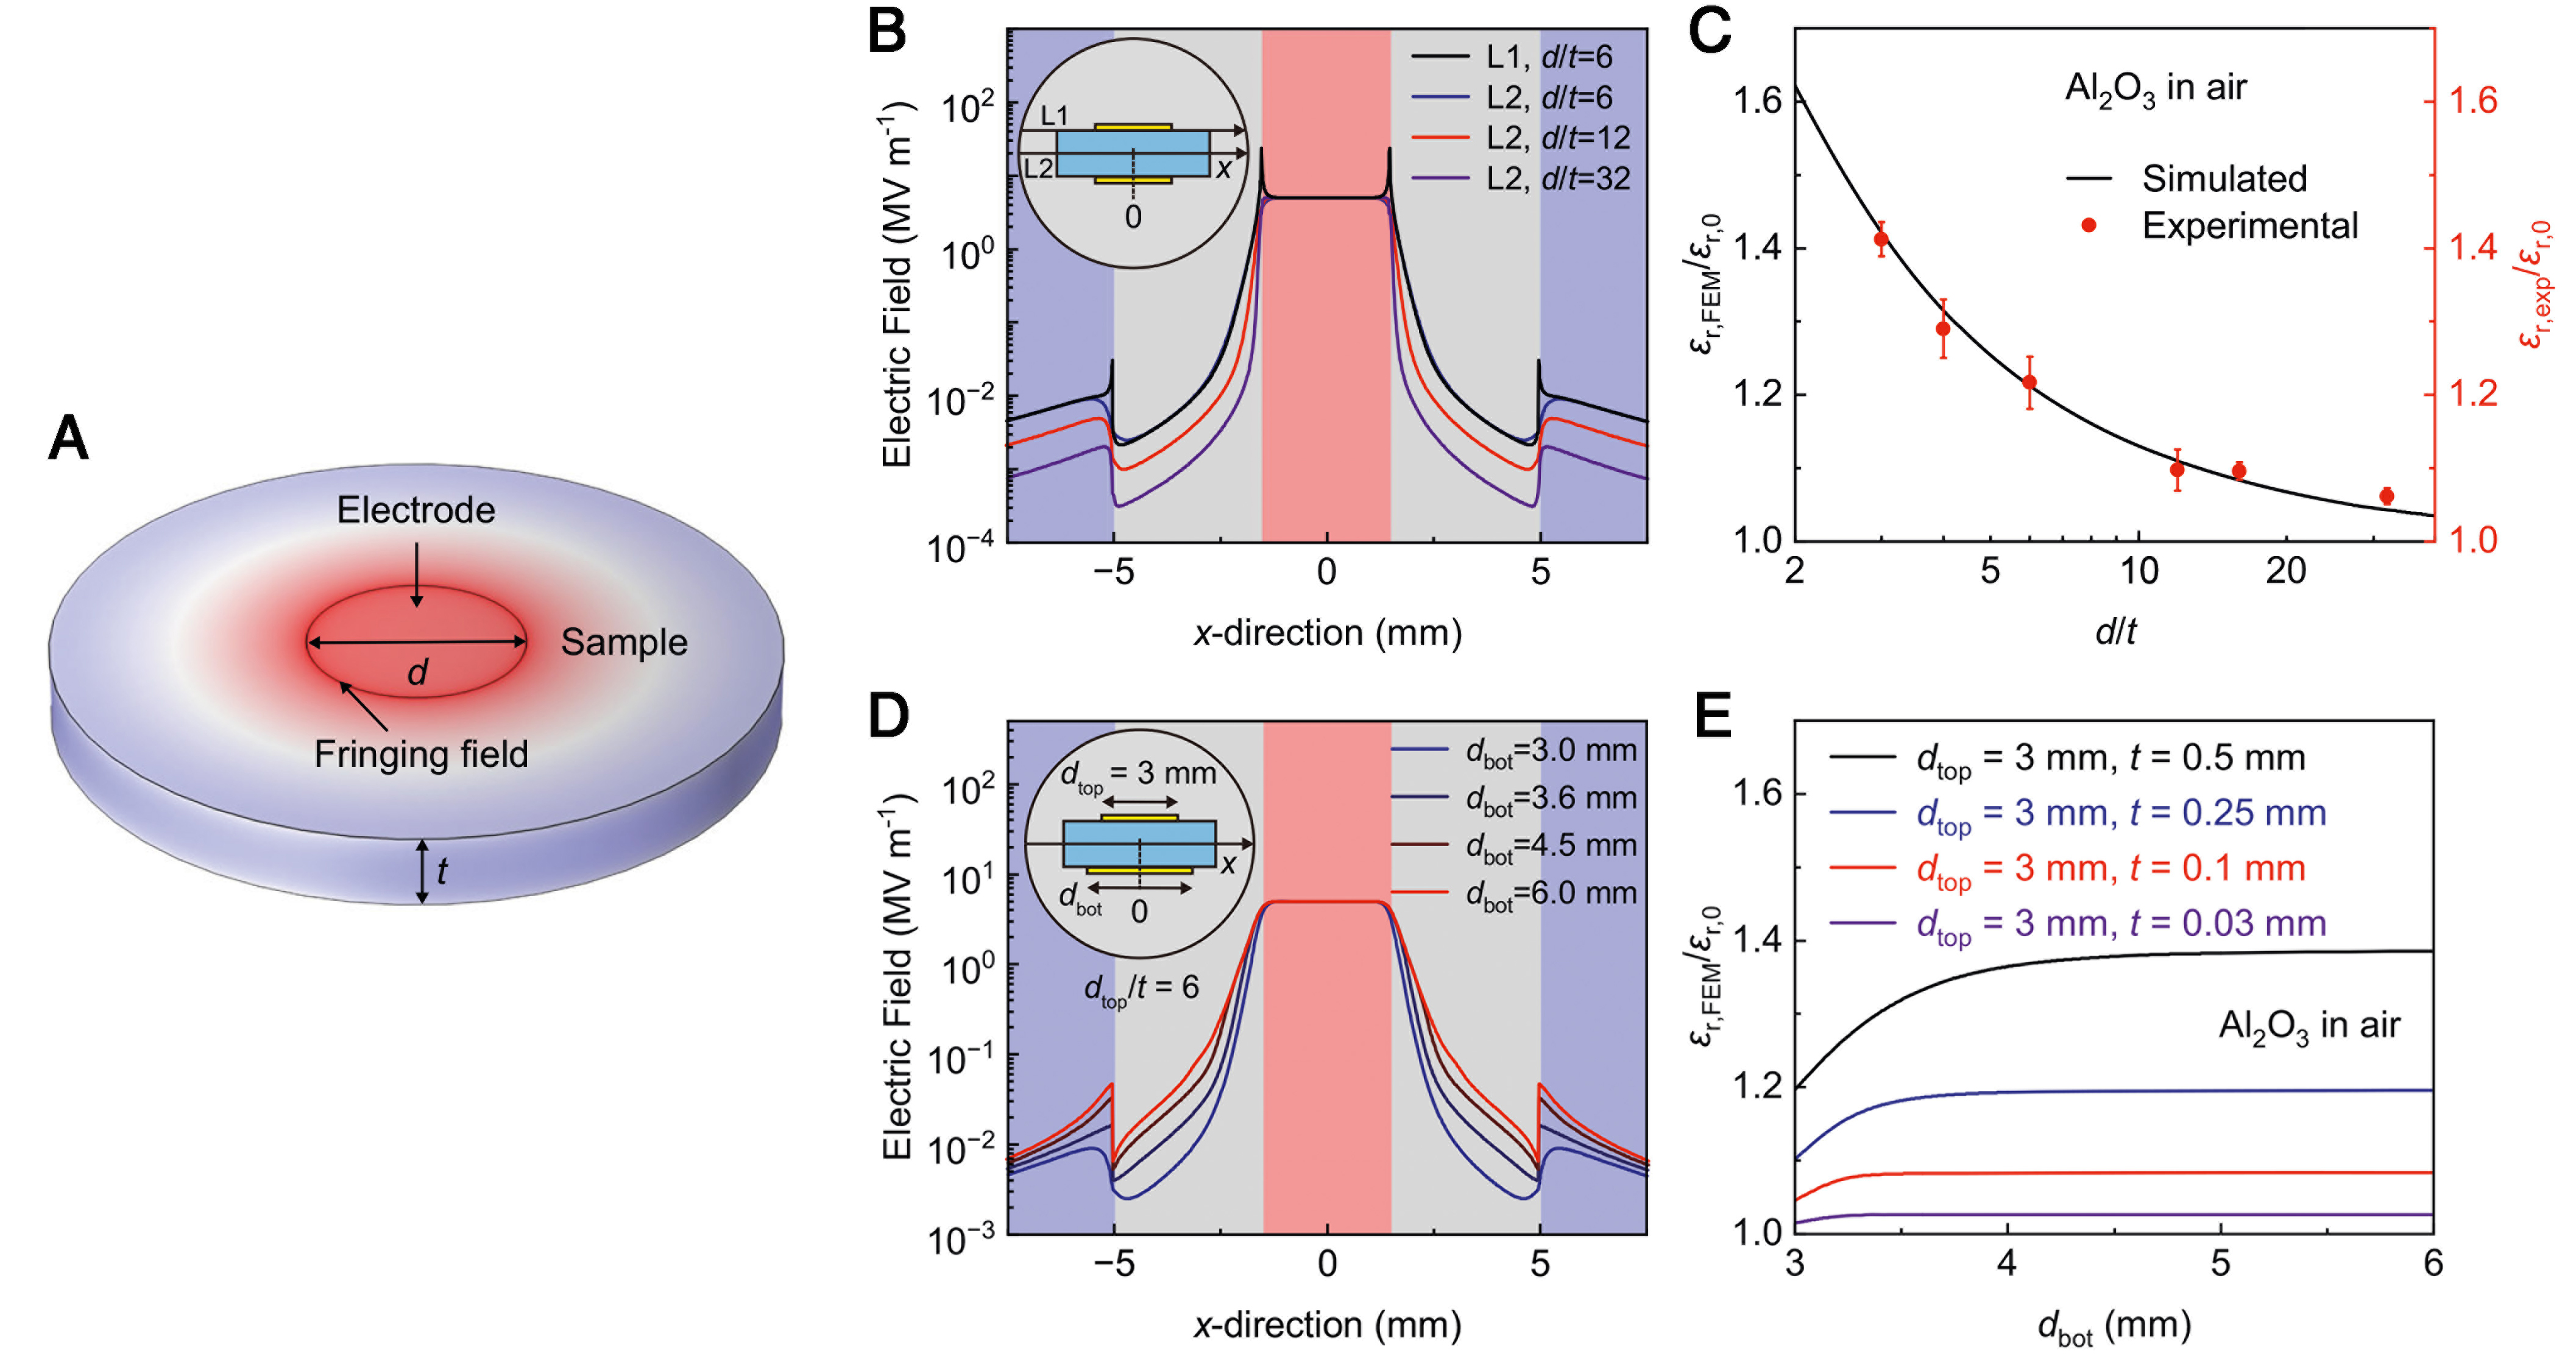
Figure 4. Finite element method simulations of parallel-plate capacitors with varying geometric configurations. (A) Schematic of the parallel-plate capacitor model; (B) Simulated electric field distributions along L1 (surface) and L2 (center) in the x-direction across the cross-section of Al2O3 in air. Light red, gray, and blue regions indicate the sample area under electrode coverage, the area outside electrode coverage, and the surrounding air, respectively; (C) Comparison of relative permittivity ratios (εr,FEM/εr,0: lines; εr,exp/εr,0: dots) for Al2O3 capacitors with different d/t ratios. Error bars denote standard deviations; (D) Electric field distributions along the x-direction at the center of the Al2O3 cross-section in air for different bottom electrode widths (dbot), with dbot = 3 mm and dielectric thickness t = 0.5 mm; (E) Dependence of εr,FEM/εr,0 on dbot. Here, εr,0 is the intrinsic dielectric constant, εr,FEM is the FEM-calculated dielectric constant, and εr,exp is the experimentally measured value. This figure is quoted with permission from Ding et al.[59]. FEM: Finite element method.


